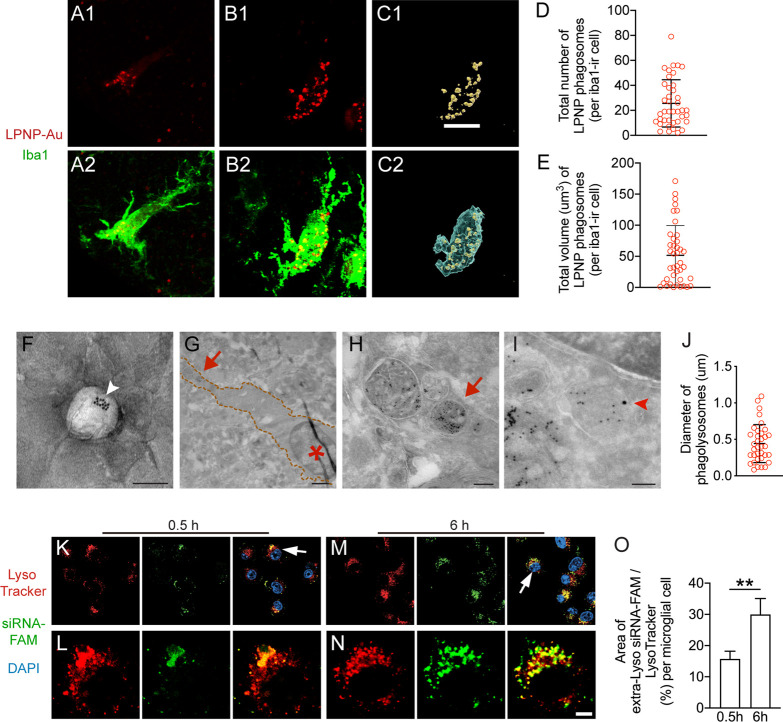
Figure 3.
Characterization of the microglial capacity to phagocytize LPNPs in the rat hypothalamus. (A, B) Small (A) or large (B) number of LPNP-Au-containing phagolysosomes (red) accumulate in ionized calcium binding adaptor molecule 1-immunoreactive (Iba1-ir, green) microglia. (C) 3D reconstruction of LPNP-Au-555-containing phagolysosomes (yellow) and Iba1-ir microglial soma (blue) based on panels (B1, B2) for the volume calculation. (D, E) Quantification of the total number and volume of the LPNP-Au-555-containing phagolysosomes in microglial cells. (F) An illustration of a LPNP-Au by electron microscopy shows a LPNP that contains several 10 nm Au particles (pointed by a white arrowhead). (G–I) Characterization of LPNP-Au nanoparticle accumulation in phagolysosomes by electron microscopy. (G) Microglia are recognized with their densely packed heterochromatin-containing nuclei (asterisk in panel G); four Au-containing phagolysosomes in the microglia distal to the nucleus indicated by the red arrow in panel (G) are shown in high magnification in panel (H); the orange-dotted lines in panel (G) frame the area covered by the microglial soma. (I) One of the 10 nm Au particle-containing phagolysosomes also contains a 15 nm Au particle derived from immunogold labeling for the lysosome marker LAMP1 (pointed by a red arrowhead). (J) Diameter of the Au-containing phagolysosomes in microglia. (K–N) The localization of the siRNA-FAM (green) in the cytosolic compartments of microglial cells with 0.5 h (K, L) or 6 h (M, N) treatment. The lysosomes in the cytosolic compartments are visualized with LysoTracker (red). Higher magnification of the cells pointed by the white arrows in panels (K) or (M) was illustrated in panels (L) or (N). (O) Ratio between the area of coverage of the extra-Lyso siRNA-FAM fluorescence signal and the LysoTracker fluorescence signal in the BV2 cells with 0.5 or 6 h treatment. All the results were presented as means ± SD. The data were analyzed using Student’s t test in panel (O). Scale bar: 10 μm in panels (A–C), 100 nm in panel (F), 1 μm in panel (G), 200 nm in panel (H), 100 nm in panel (I), 15 μm in panels (K, M), and 5 μm in panels (L, N).

