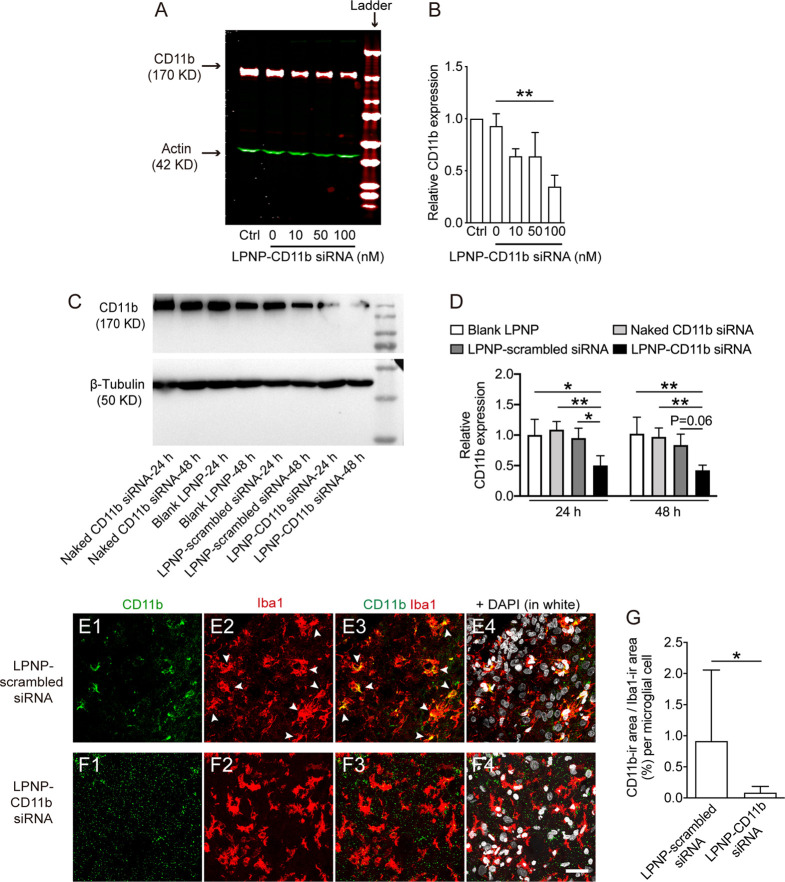
Figure 4.
Evaluation of the silencing efficiency by LPNP-CD11b siRNA in vitro and in vivo. (A, B) After the BV2 cells were treated with LPNP-CD11b siRNA at various siRNA concentrations (0, 10, 50, and 100 nM, with 0 nM representing LPNP-scrambled siRNA (100 nM), n = 3), the expression of CD11b was assessed by western blotting. (C, D) In alternative groups, the CD11b protein expressions in the brain tissues isolated from the non-treated control, naked CD11b siRNA, blank LPNP, LPNP-scrambled siRNA, and LPNP-CD11b siRNA injected spots were assessed by western blotting. (E–G) Representative images from the rat hypothalamus after the injection of LPNP-scrambled siRNA (100 nM) or LPNP-CD11b siRNA (100 nM) show colocalization of CD11b-ir in ionized calcium-binding adaptor molecule 1-immunoreactive (Iba1-ir) microglia in the LPNP-scrambled siRNA group (E1–E4), whereas little CD11b-ir is detectable in the LPNP-CD11b siRNA group (F1–F4). The arrowheads in panels (E2, E3) point to Iba1-ir microglia (red) containing CD11b (green) immunoreactivity in the LPNP-scrambled siRNA group. (G) Analysis of the ratio between the coverage area of CD11b and Iba1-ir per microglia. n = 3. All data are presented as means ± SD. Data were analyzed using one-way ANOVA in panel (B), two-way ANOVA in panel (D), and Student’s t test in panel (G). *p < 0.05, **p < 0.01. Scale bar: 30 μm in panels (E, F).

