. 2021 Nov 23;82(2):199–209. doi: 10.1158/0008-5472.CAN-21-1903

Figure 1.

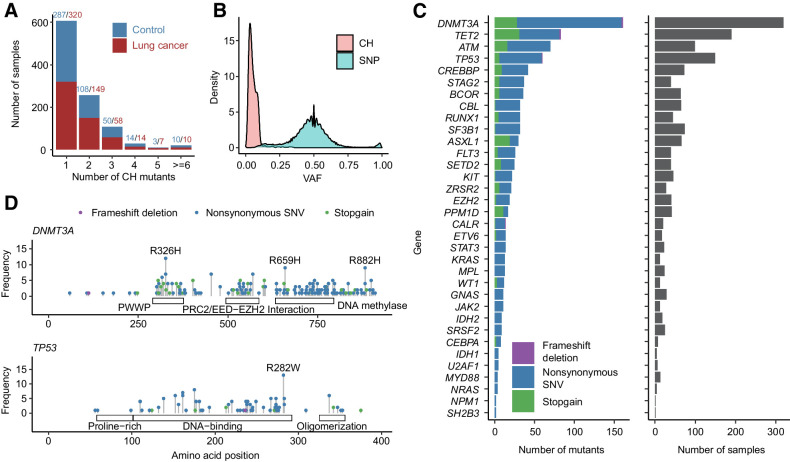
Figure 1. Overall distribution of CH mutations. A, Distribution of number of CH mutations in each sample. Most of the samples had 1–2 CH mutations. Red and blue denote number of CH mutations in patients with lung cancer and controls, respectively. B, VAF distribution of CH mutations and SNP. Most of CH mutations had VAF < 0.1. C, Number and type of CH mutations in 34 CH hotspot genes. D, CH mutation sites in DNMT3A and TP53. Mutations with samples ≥ 8 were labeled.

Overall distribution of CH mutations. A, Distribution of number of CH mutations in each sample. Most of the samples had 1–2 CH mutations. Red and blue denote number of CH mutations in patients with lung cancer and controls, respectively. B, VAF distribution of CH mutations and SNP. Most of CH mutations had VAF < 0.1. C, Number and type of CH mutations in 34 CH hotspot genes. D, CH mutation sites in DNMT3A and TP53. Mutations with samples ≥ 8 were labeled.