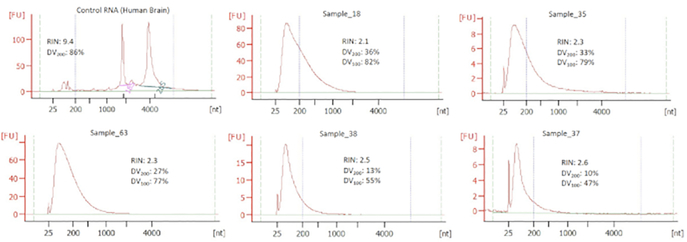
Figure 2: Example Bioanalyzer traces of six different FFPE-RNA samples.
The horizontal axis denotes the molecular weight (bp) and fluorescence units (FU) and the vertical axis shows the concentration of different sized fragments. The RNA Integrity Numbers (RIN), DV200 (i.e., percent of fragments >200 bp), and DV100 (i.e., percent of fragments >100 bp) values are indicated on each profile. A 25 bp peak in each profile indicates the molecular weight marker.

