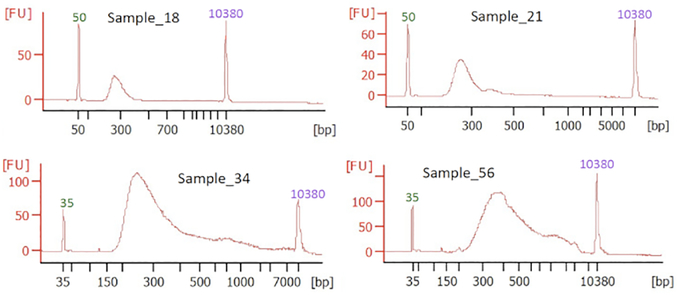
Figure 3: Example Bioanalyzer traces of final libraries prepared from four different samples.
The horizontal axis denotes the molecular weight (bp) and fluorescence units (FU) on the vertical axis indicate the concentration of different sized fragments. The lower (35 bp or 50 bp) and upper (10,380 bp) marker peaks are labeled in green and purple, respectively.

