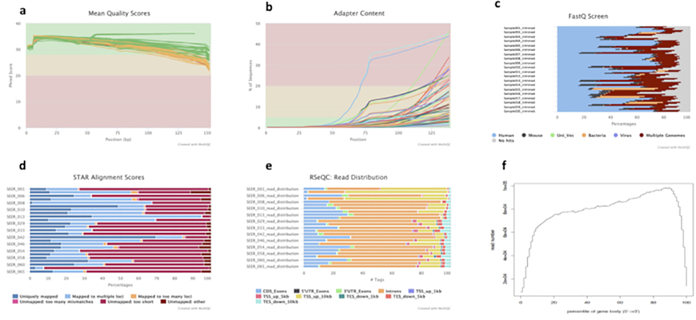
Figure 4: Example multi-QC report for preprocessing QC results.
(A) Line chart showing the percentages of Q30 bases of all sequencing reads in each sample. (B) Sequencing adapter content in raw fastq files. (C) Contamination screen to check closely matched species. (D) Genome mapping statistics. (E) Read distribution based on Gencode gene annotation. (F) Gene body/transcript coverage

