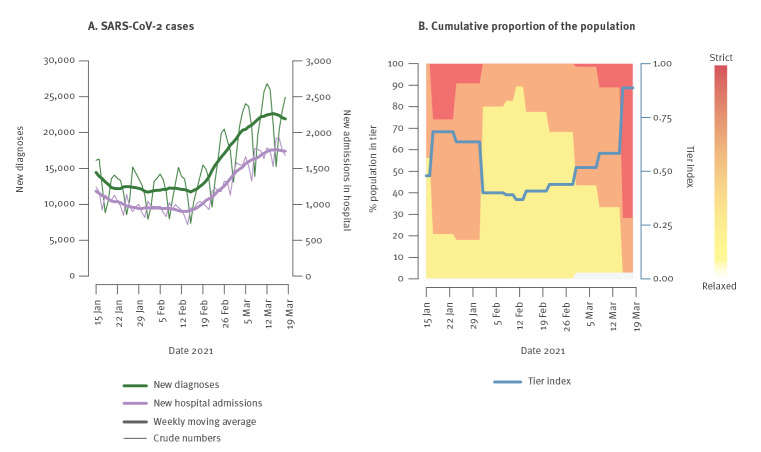
Figure 1.
Epidemiological COVID-19 situation in Italy between 15 January and 18 March 2021
COVID-19: coronavirus disease.
Data sources for panel A: new diagnoses [26]; hospital admissions [27]. Data source for panel B: population in white, yellow, orange and red tiers [29]. A value of 0 for the tier index implies that the entire population is in the most relaxed tier (white) and a value of 1 implies that the entire population is in the most strict tier (red).

