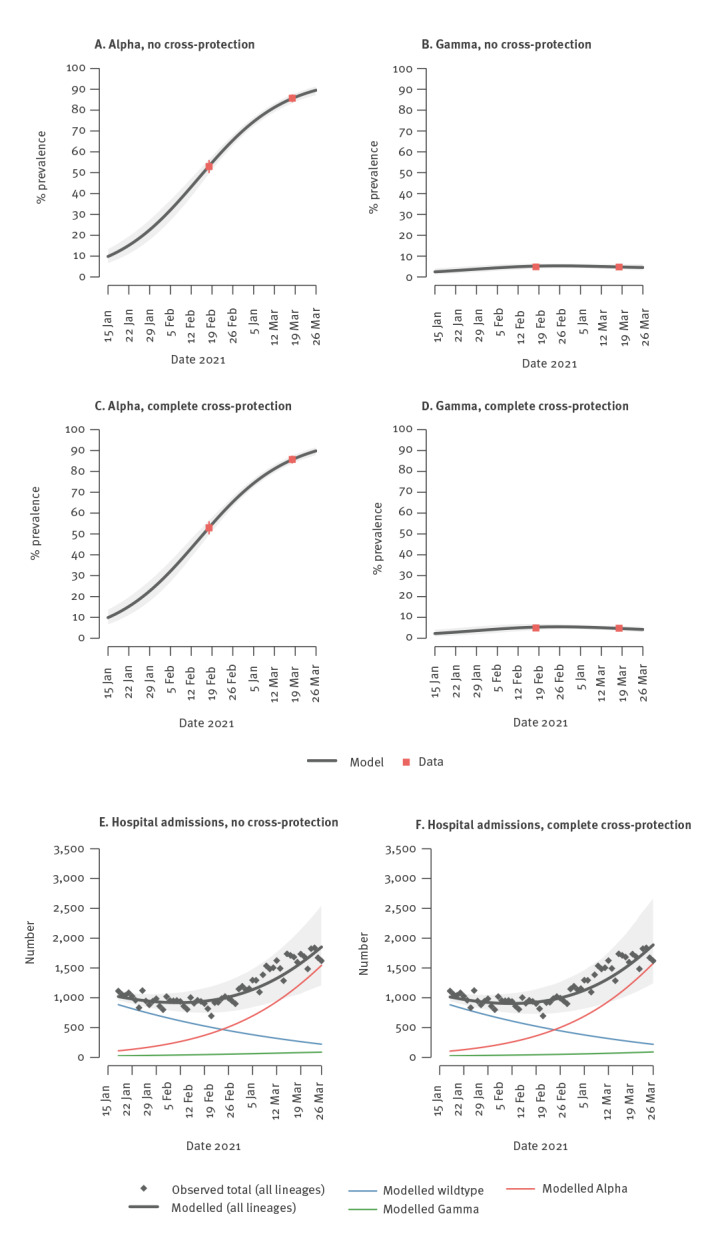
Figure 3.
Model fits for prevalence of SARS-CoV-2 variants of concern and hospital admissions, Italy, 18 January–18 March 2021
CrI: credible intervals; SARS-CoV-2: severe acute respiratory syndrome coronavirus 2.
Panels A–D: Model estimates, solid black lines: mean values; shaded areas: 95% CrI. Observed data, red points: mean values: red lines: 95% CrI. At each time, the model-estimated prevalence for a given lineage is computed as the ratio of simulated number of infectious individuals with that lineage and the simulated total number of infectious individuals. Panels E and F: Model-estimated and observed hospital admissions over time under the assumption of no cross-protection between wildtype or Alpha and Gamma. Black lines: mean values of model-estimated overall daily hospitalisations; shaded areas: 95%CrI. Coloured lines: mean values of model-estimated daily hospitalisations; black points: observed daily hospitalisations

