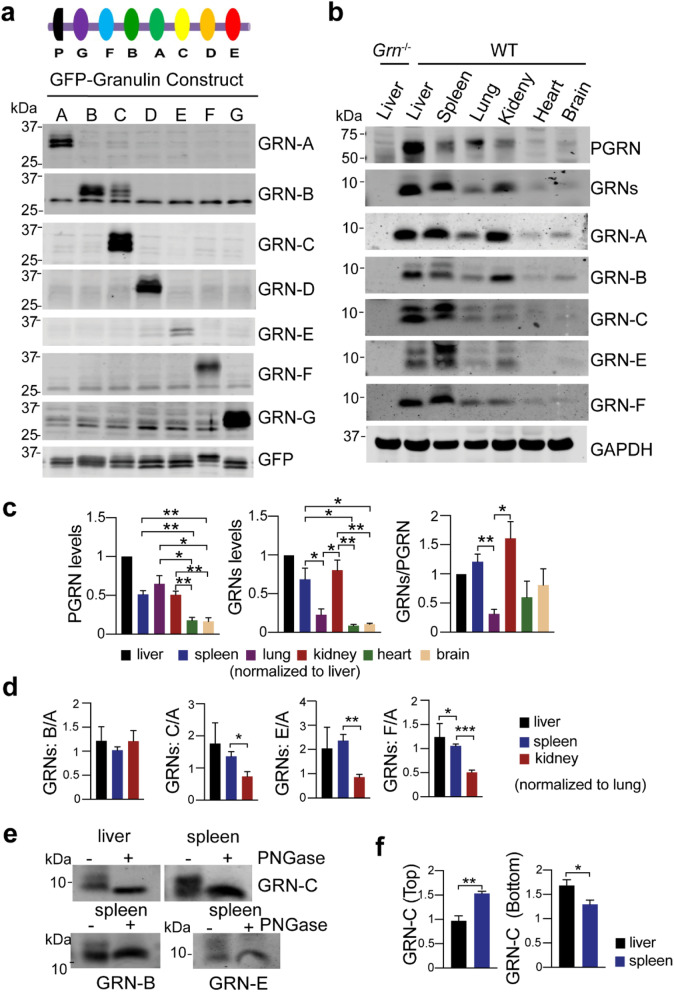
Fig. 1.
Characterization of granulin antibodies and analysis of granulin levels in tissue lysates. a HEK293T lysates containing GFP or GFP tagged mouse granulins were probed with antibodies against each individual granulin peptide as indicated. Diagram of PGRN structure was shown at the top. b Western blot analysis of different tissues lysates from 4 to 5 months old WT and Grn−/− mice with antibodies against each individual granulin, granulin A (GRN-A), granulin B (GRN-B), granulin C (GRN-C), granulin E (GRN-E) and granulin F (GRN- F) as indicated. Full length PGRN and total PGRN-derived granulins (GRNs) were detected by commercial sheep anti-mouse PGRN antibodies (R&D). Mixed male and female mice were used for this analysis. c Quantification of experiment in (b). The ratio between PGRN and GAPDH; granulins and GAPDH and between granulins and full-length PGRN was quantified and normalized to that in the liver sample on the same gel (set as 1). Data presented as mean ± SEM. n = 3. *, p < 0.05, **, p < 0.01, ***, p < 0.001, ****, p < 0.0001, unpaired two-tailed Student’s t-test. d Quantification of the ratios between granulins B/C/E/F and granulin A. The band intensities of different granulins were measured and normalized to GAPDH. The ratios between granulins B/C/E/F and granulin A were calculated and normalized to the lung sample on the same gel (set as 1). Data presented as mean ± SEM. The ratio of GRN-C (p = 0.04), GRN-E (p = 0.0057), GRN-F (p = 0.0006), but not GRN-B (p = 0.4586) versus GRN-A is significantly lower in kidney than that in lung. *, p < 0.05, **, p < 0.01, ***, p < 0.001, unpaired two-tailed Student’s t-test. e Granulin B, C, and E are glycosylated. Spleen or liver lysates from WT mice were immunoprecipitated using anti-granulin B, C, or E antibodies and the immunoprecipitates were treated with PNGase F. f Quantification of two differentially glycosylated forms of granulin C for experiments in (b). The ratio between top or bottom bands of granulin C and GAPDH in liver and spleen lysates was quantified and normalized to their levels in the lung. Data presented as mean ± SEM. n = 4. Top bands (p = 0.0023), bottom bands (p = 0.04), *, p < 0.05, **, p < 0.01, unpaired two-tailed Student’s t-test

