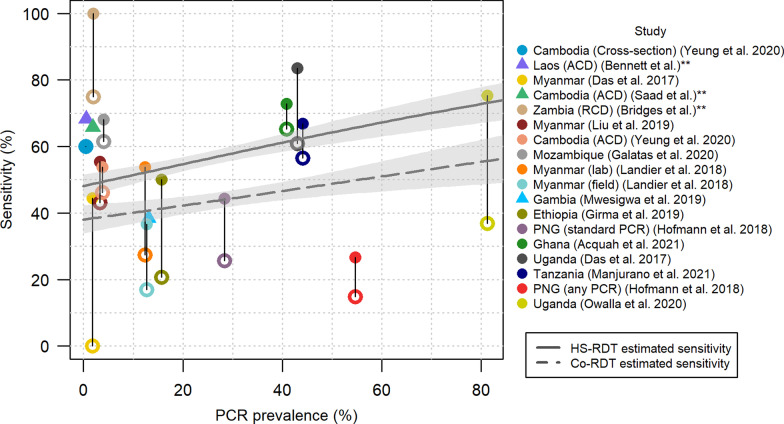
Fig. 4.
Sensitivity of the HS-RDT and co-RDT against PCR prevalence. The filled circles and triangles show the sensitivity of HS-RDT. The unfilled circles joined to the filled circles by a line show the sensitivity of the co-RDT in the same study, if this test was used. The triangles indicate studies where a co-RDT was not used. PCR is the gold-standard diagnostic against which sensitivity is calculated. The solid grey and dashed grey lines show the fit from a binomial generalised linear model of the relationship between PCR prevalence and sensitivity of the HS-RDT and co-RDT respectively. **Unpublished studies. RCD reactive case detection, ACD active case detection

