
Figure 1.
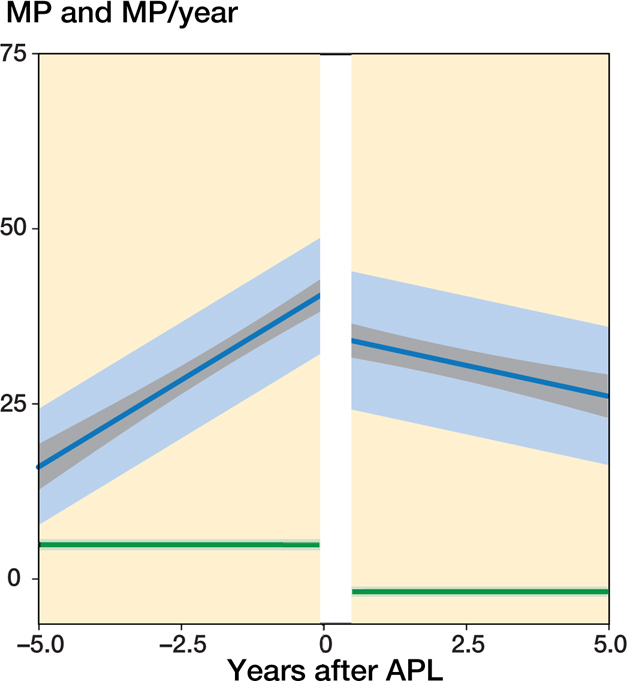
Predicted mean MP development with time before and after APL without a 2nd operation at the end of follow-up. Population mean with 95% CIs (gray), and 1 SD of the individual means (light blue). Predicted mean MP velocity (MP/year) and the 95% CI (green).