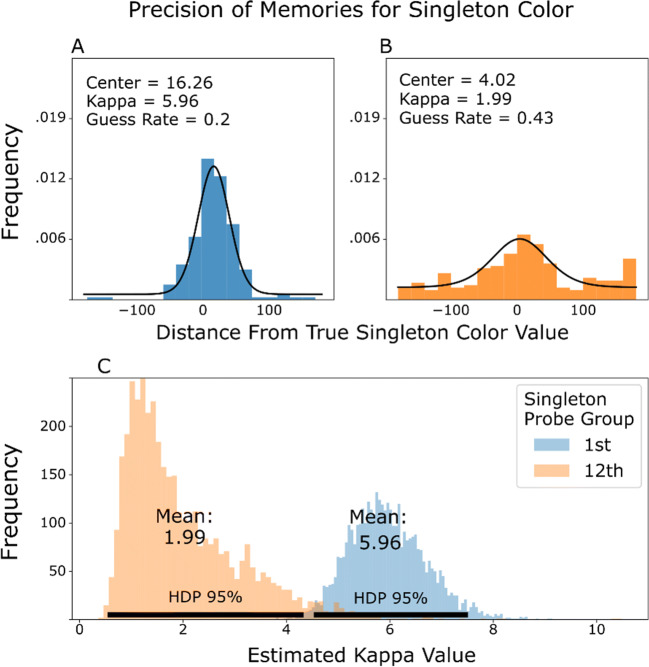
Fig. 8.
a Best fit working memory mixture model for the Trial-1 group (blue), overlayed on the distribution of actual responses. Distance from the true singleton color value is in color degrees. The Center parameter reflects the central tendency of the distribution. The rightward shift is towards the color category center, suggesting a center-bias in memory. Kappa reflects the precision of the memory where larger numbers indicate greater precision. Guess rate indicates the probability that the probed item was not present in memory at the time of the probe. b Same as a, but for the Trial-12 group (orange). c Distribution of posterior estimates of the concentration parameter (kappa) for each group. Black bars at the bottom indicate the 95% HDI for each group. Precision was significantly greater for the Trial-1 group compared with the Trial-12 group. (Color figure online)

