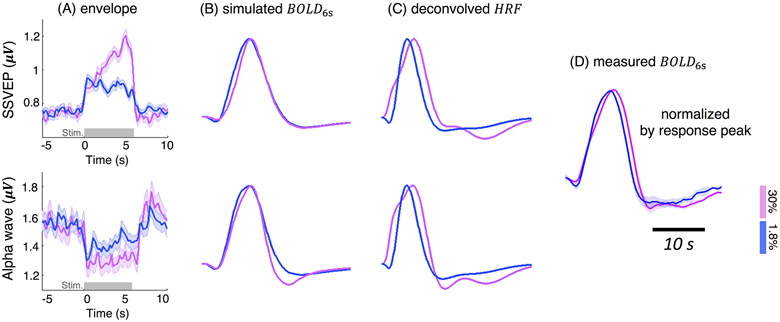
Figure 3.
Contrast-dependent patterns of SSVEP/alpha oscillations (A, mean and standard errors across all 6-s trials and all subjects) and the predicted BOLD responses (B, C); all BOLD responses were normalized by the peak intensity for comparisons. ‘simulated BOLD6s’: simulated hemodynamic changes elicited by the 6-s stimuli, according to the EEG-based forward biophysical modeling (Model I ‘Balloon Model’); ‘deconvolved HRF’: HRF1.8% and HRF30% derived by linearly deconvolving EEG signatures from fMRI measurements (Model II ‘Deconvolution Model’); ‘measured BOLD6s’: fMRI responses evoked by the 6-s stimuli, normalized by response peaks (Fig. 1B).

