
Figure 2:
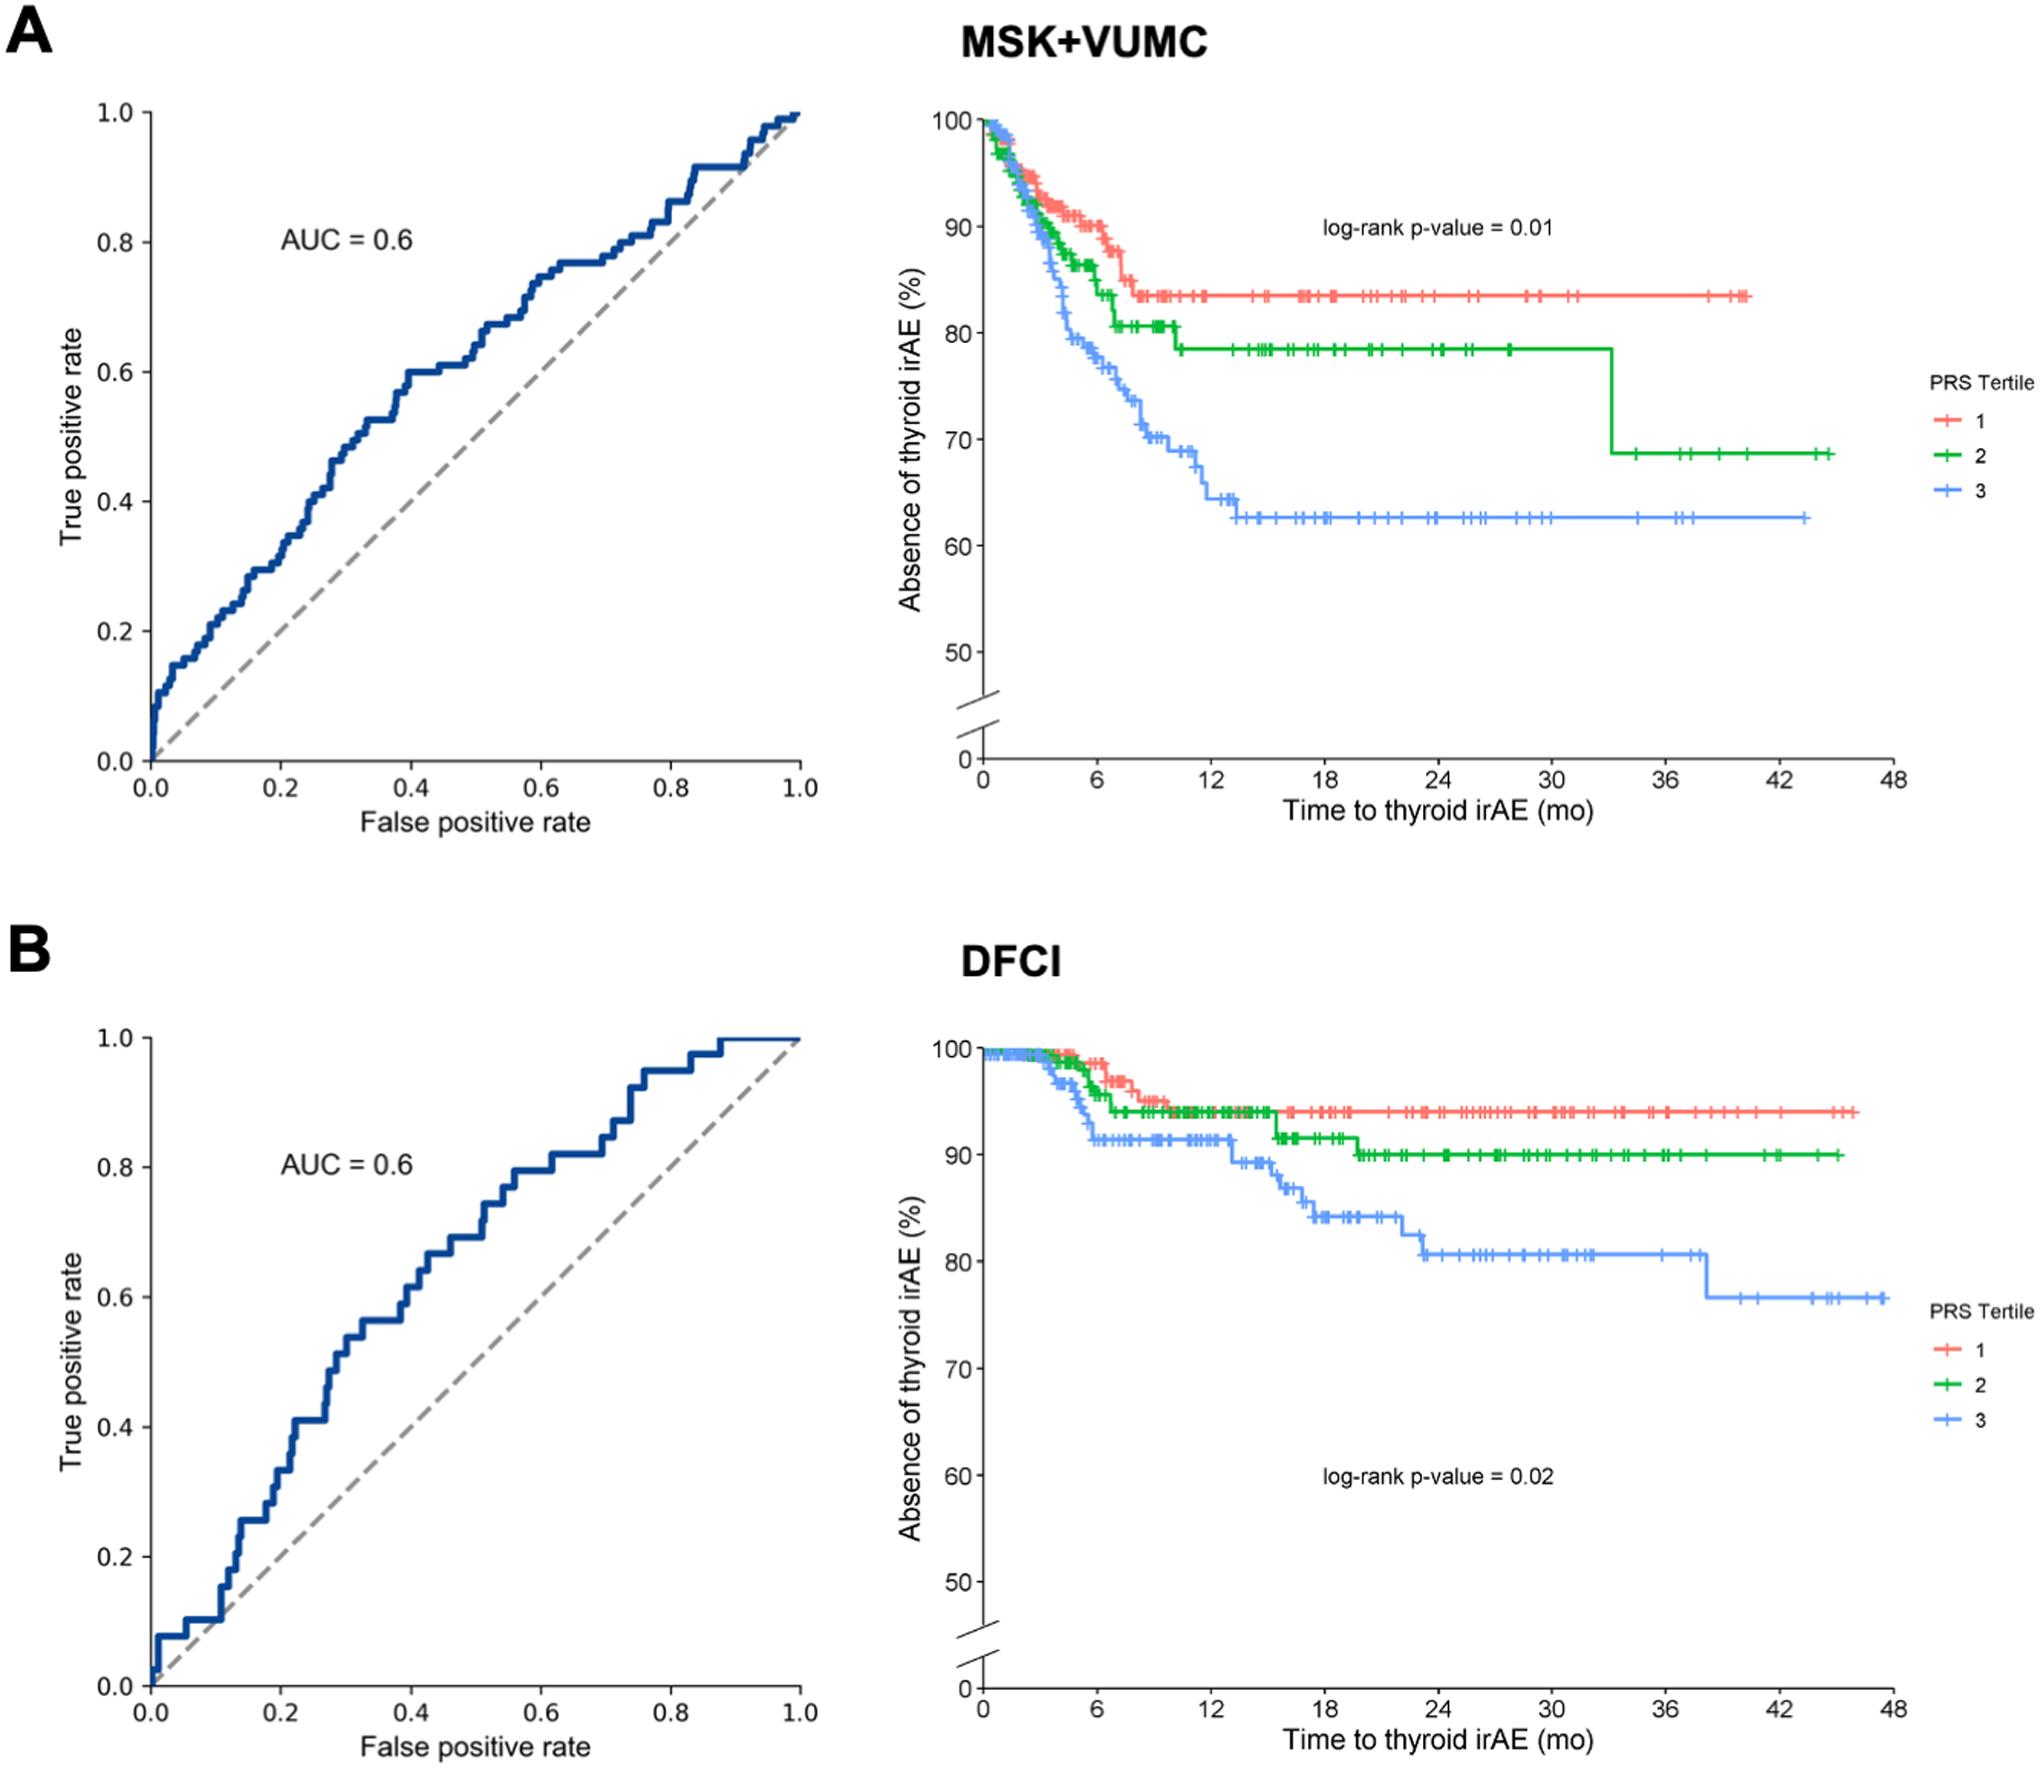
Hypothyroidism PRS (using self-reported hypothyroidism) as a predictor of CPI-induced thyroid irAEs in the (A) MSK+VUMC cohort and (B) the DFCI cohort. The left panel shows the ROC curve and right panel shows time to event by PRS tertile. P-values for the three curves are calculated using a log-rank test.