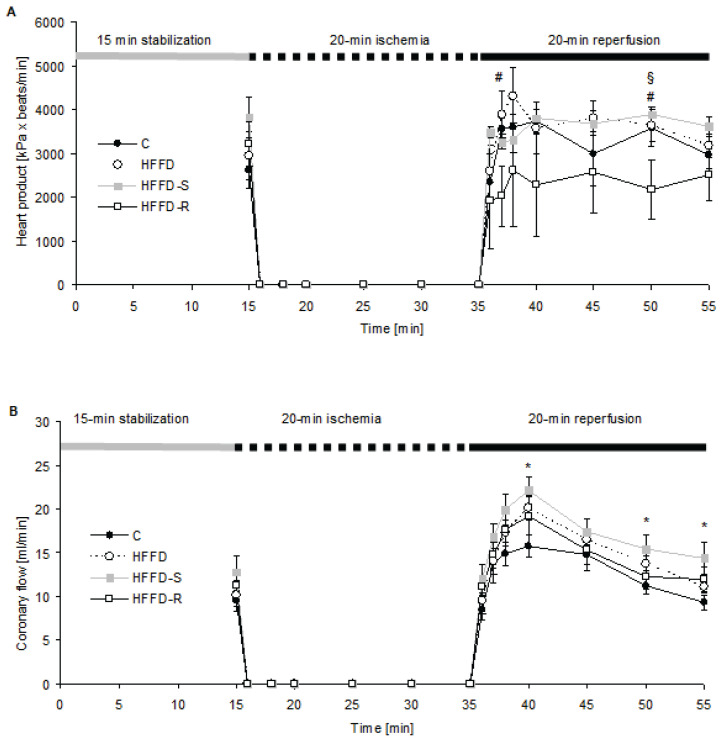
Fig. 2.
The heart product (A) and coronary flow (B) course during the whole experiment on rat isolated and perfused hearts exposed to ischemia/reperfusion. The values are means±SEM. A number of rats per group, n = 10. Experimental group abbreviations are explained in Fig. 1. (A) Significant difference at 2nd and 15th min of reperfusion #p < 0.05 HFFD-R vs. HFFD, §p < 0.05 HFFD-R vs. HFFD-S. (B) Significant difference at 5th, 15th and 20th min of reperfusion *p < 0.05 vs. C vs. HFFD-S, ANOVA, Bonferroni comparison test.

