Figure 2.

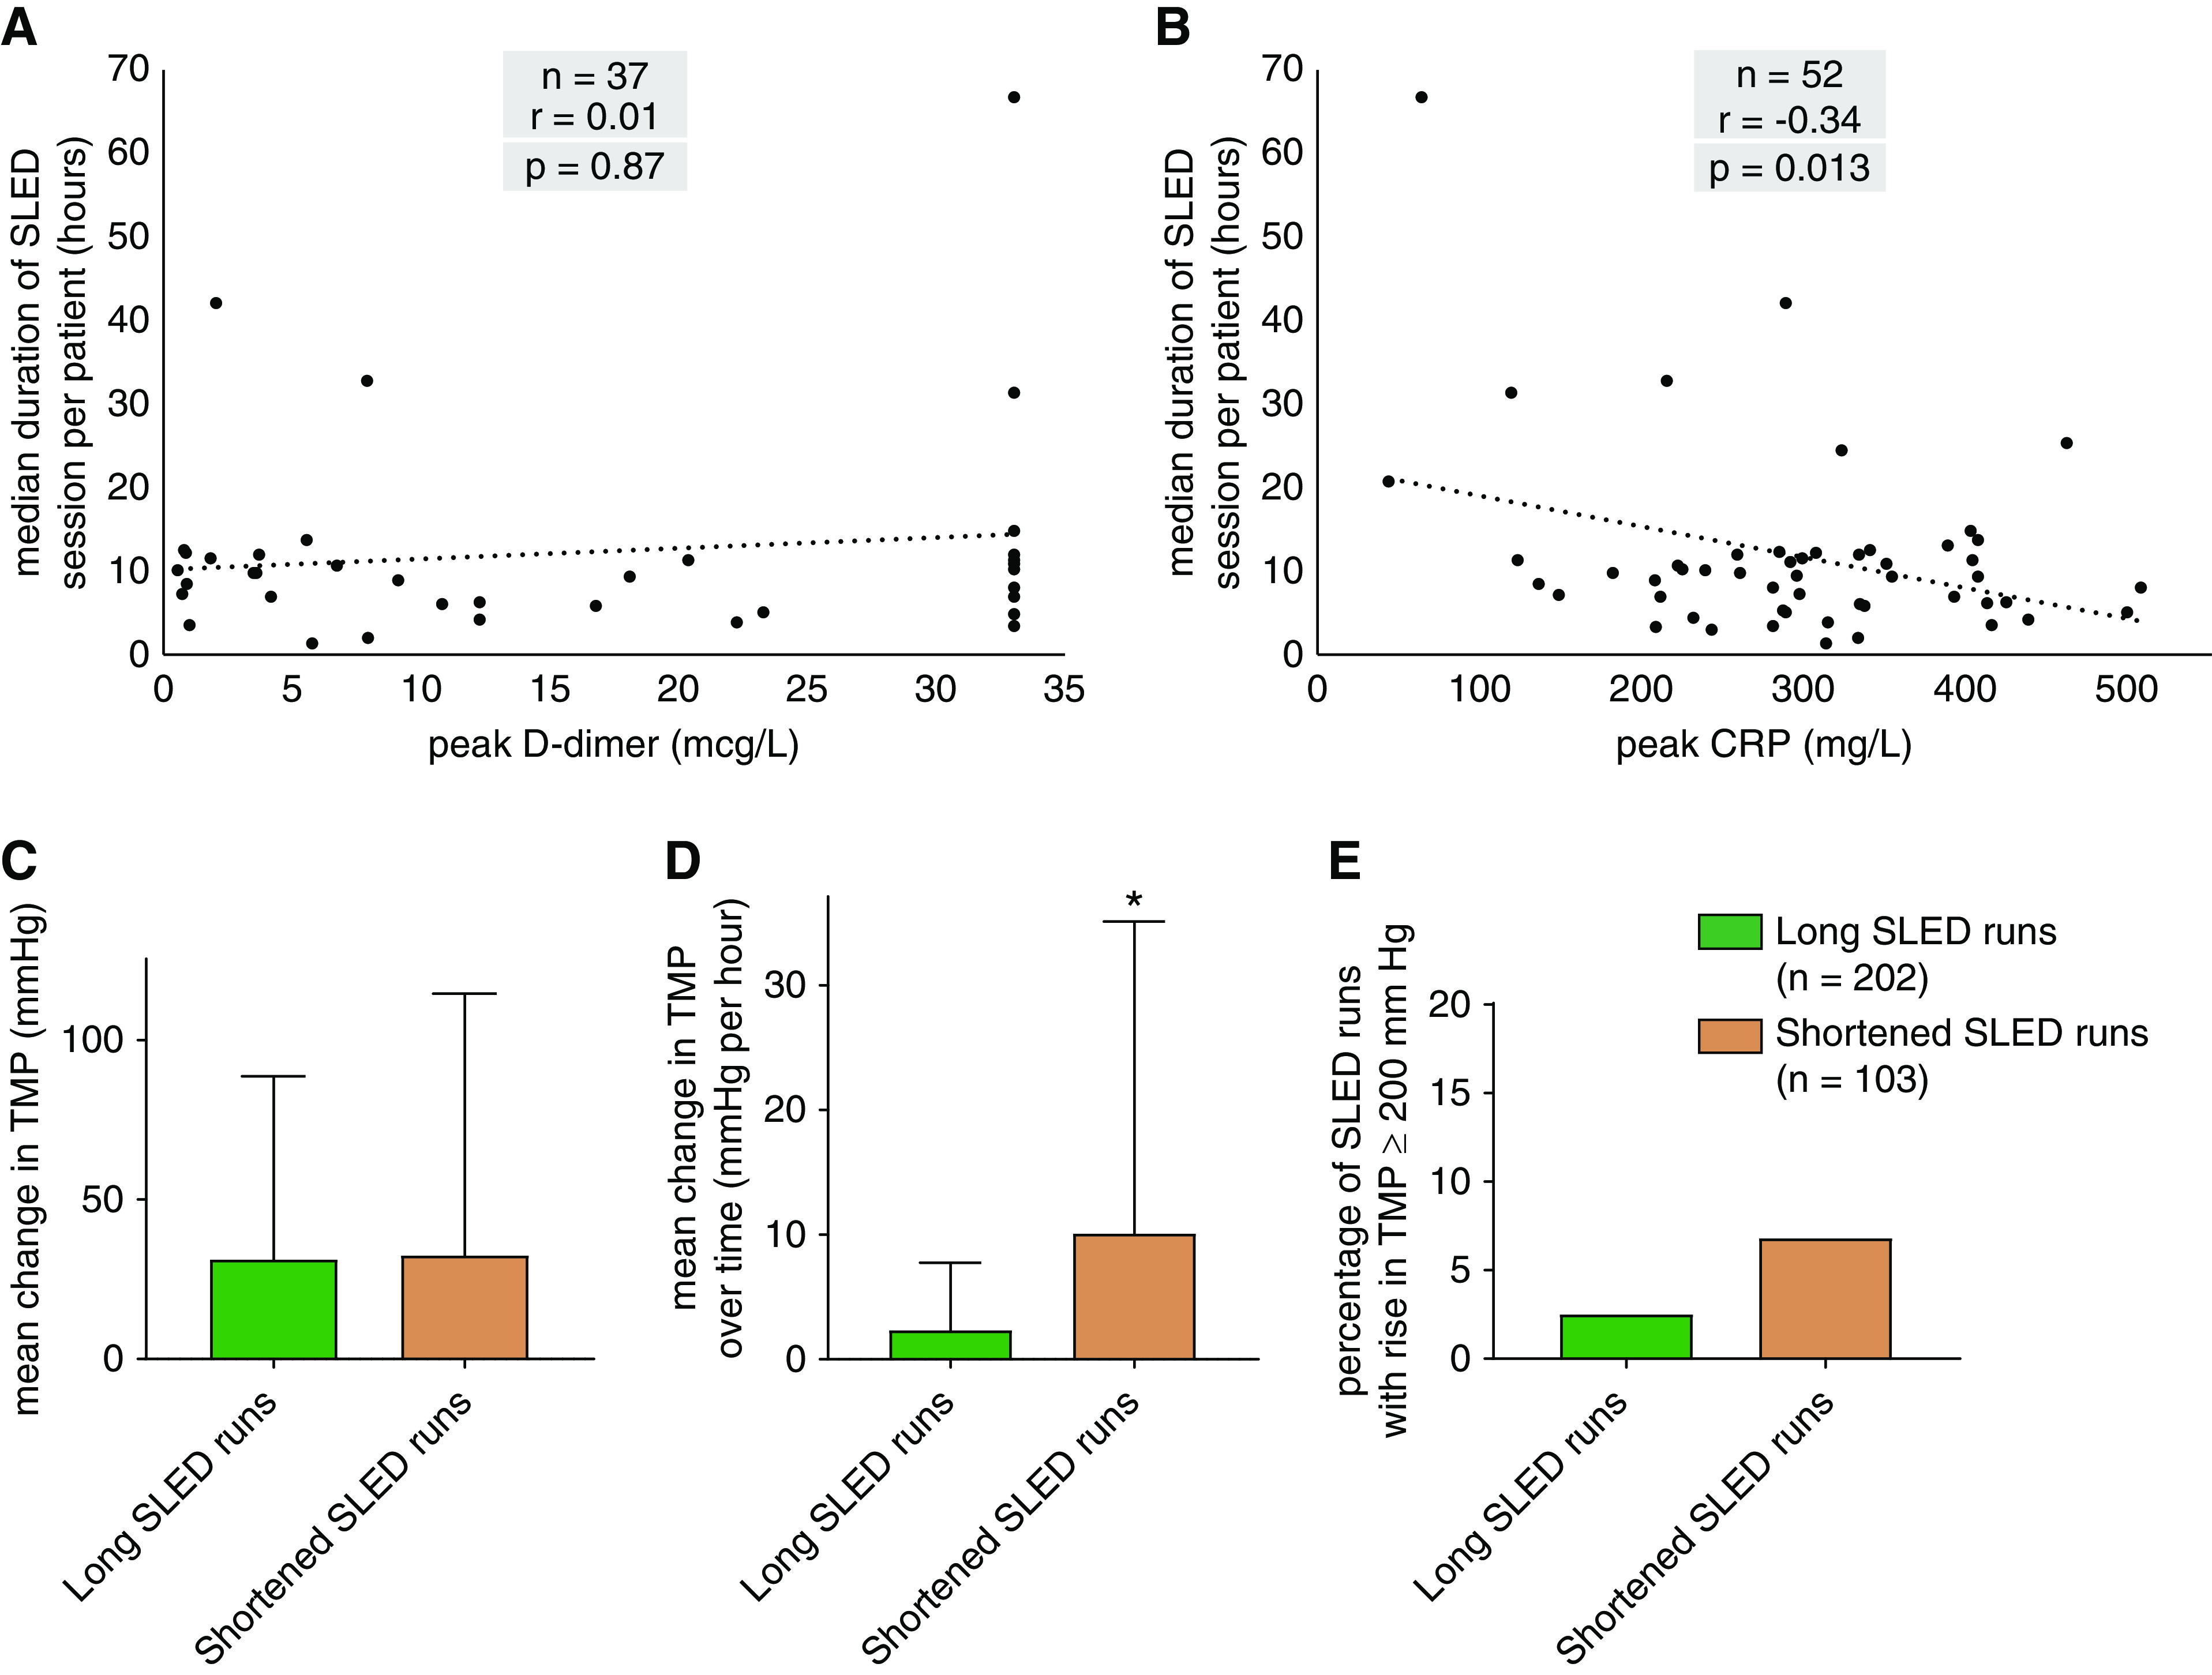
Relationship between markers of thrombogenicity and inflammation and dialysis circuit interruptions in patients with CoV-AKI-RRT. (A) Correlation between peak D-dimer value and median duration of SLED sessions (NS). (B) Correlation between peak C-reactive protein (CRP) value and median duration of SLED sessions (significant). (C–E) Comparison of changes in intradialyzer transmembrane pressure (TMP) during long (lasting ≥6 hours) and shortened SLED runs represented by mean change in TMP (C), mean change in TMP over time (D), and proportion of SLED runs with rise in TMP ≥200 mm Hg (E). * P<0.001.
