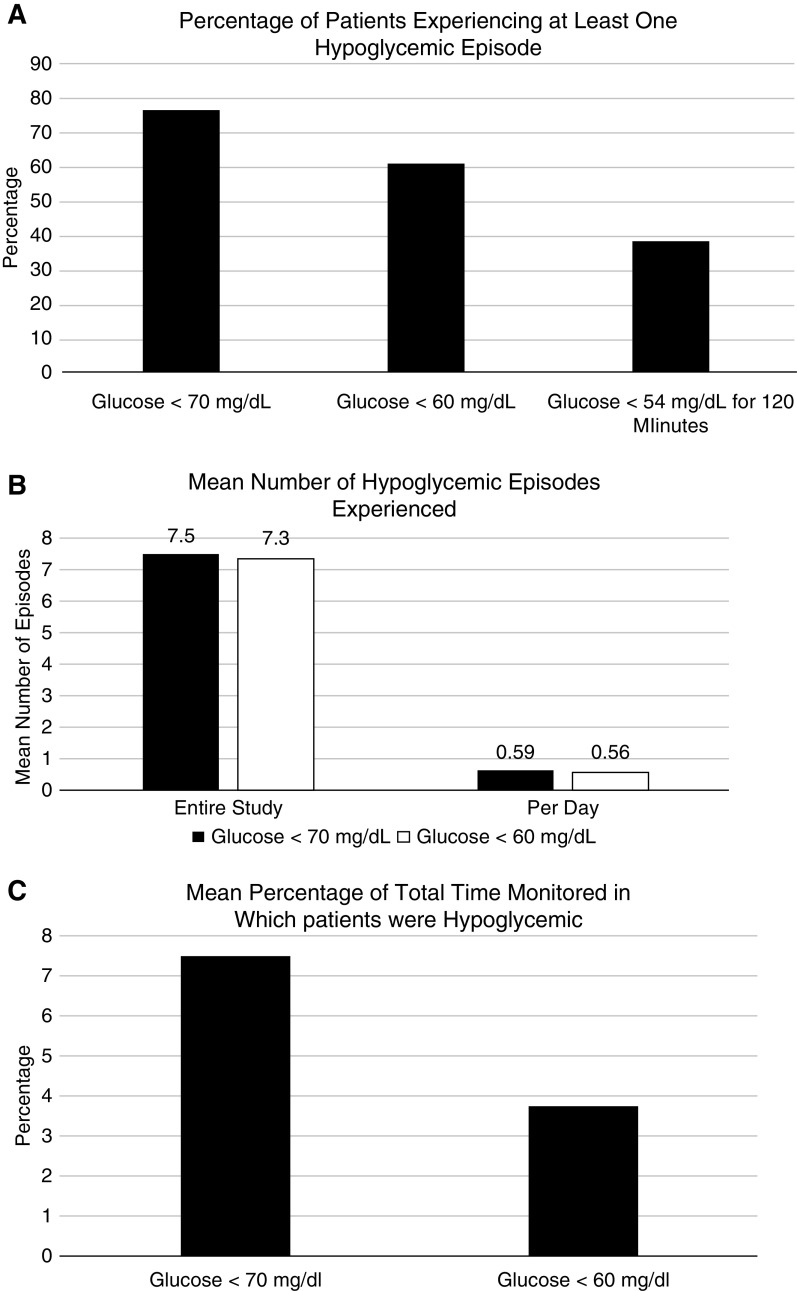
Figure 1.
Hypoglycemia in CKD and type 2 diabetes. (A) With a mean of 12.7±2.9 days of wearing the continuous glucose monitor (CGM) device, with measurements every 15 minutes, this figure displays the percentage of patients experiencing at least one hypoglycemic episode of ≥15 minutes. The first column has hypoglycemia defined as glucose <70 mg/dl; the second is glucose <60 mg/dl; and the third is the percentage of patients experiencing a severe, prolonged event. (B) This figure displays the total number of hypoglycemic episodes of at least 15 minutes per patient. The first set of two vertical bars represent the number of episodes over the entire mean 12.7±2.9 days wearing the CGM device for glucose <70 mg/dl (black) and 60 mg/dl (white). The second set of vertical bars represents the mean number of hypoglycemic episodes per day per patient. (C) This figure displays the total percentage time per patient in which the patient was hypoglycemic over the course of study, for glucose <70 mg/dl and <60 mg/dl.

