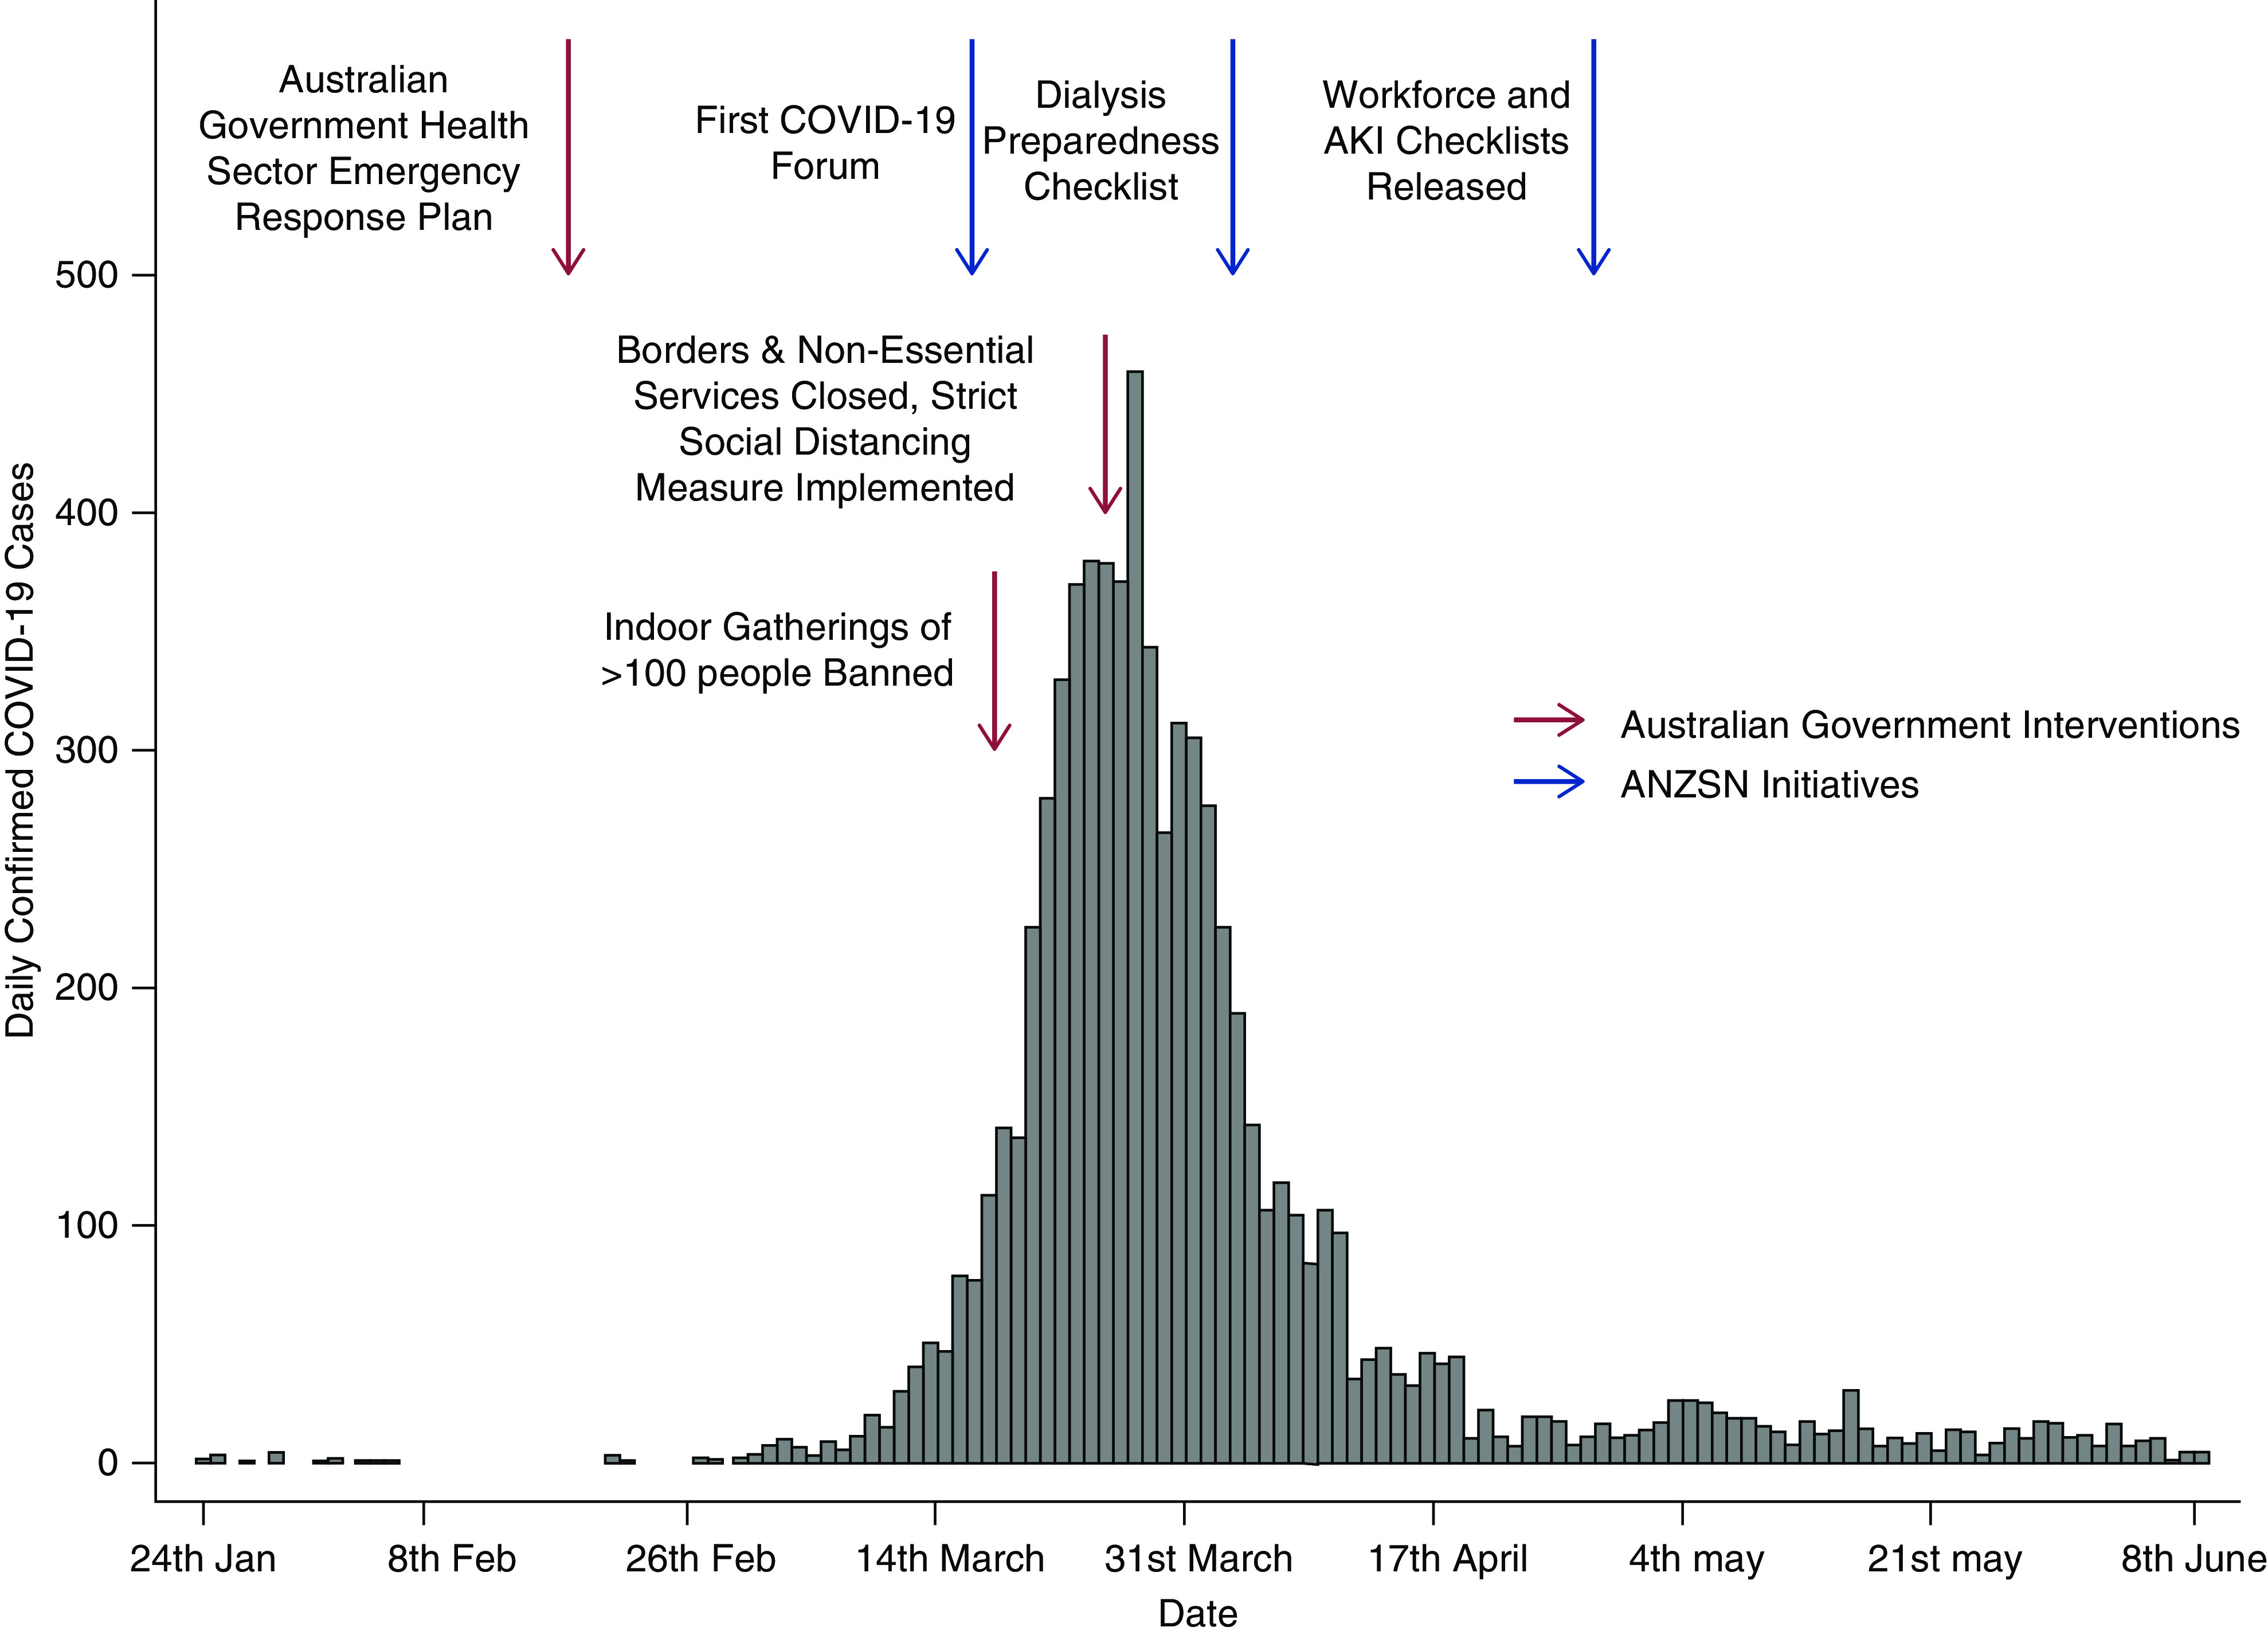
Figure 1.

Daily coronavirus disease 2019 (COVID-19) infection numbers in Austraia January 24th to June 8th, 2020 showing peak cases mid to late March. Blue and red arrows illustrate timing of Australian Government and Australian and New Zealand Society of Nephrology (ANZSN) initiatives in relation to daily COVID-19 infection numbers.
