
Extended Figure 8: In vivo potency trial endpoints of Med114FH PDXs treated with EPHA2 CAR T cells.
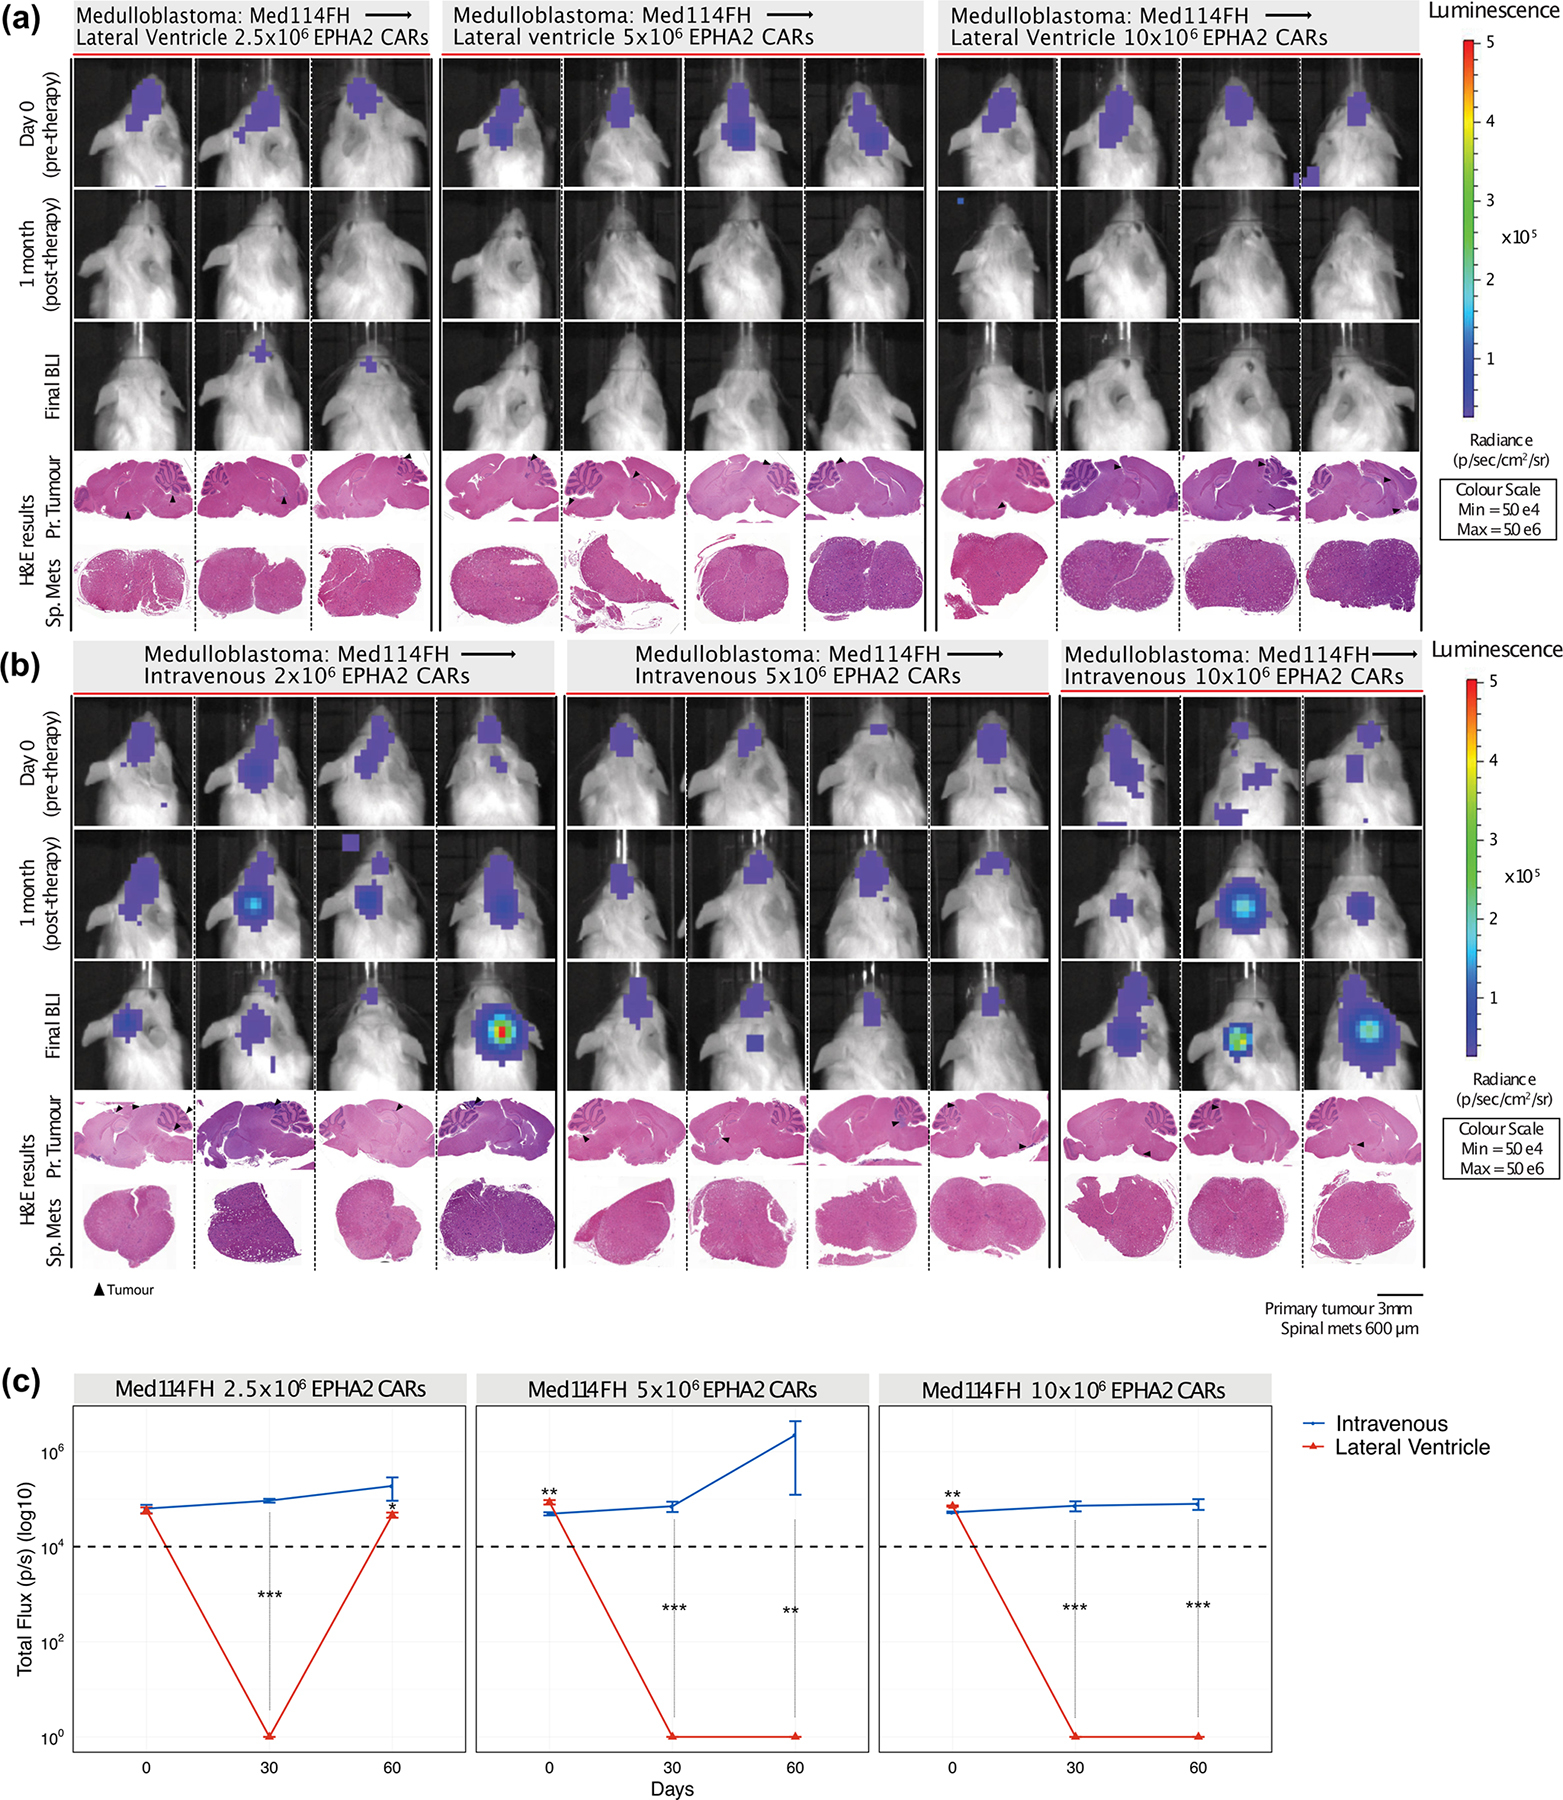
Bioluminescence (BLI) and endpoint Hematoxylin-eosin (H&E) staining analysis of NSG mice xenografted with luciferase-expressing Med114FH, infused (a) via the lateral ventricle or (b) IV with EPHA2 CAR T cells at dose range of 2.5×10⁶, 5.0×10⁶ and 10×106 as indicated (colour map for all images indicates radiance, min = 5×10⁴, max = 5×10⁶). Each column represents one mouse, each row represents the indicated time point and subsequent final BLI. Results representative of 2 independent replicates. (c) Measurement of tumour burden over time expressed as Total Flux (photons/s) following one round of lateral ventricle versus IV EPHA2 CAR T cell therapy. ***P<0.0005, **P<0.005, *P<0.05, by two-sided ANOVA followed by Tukey post hoc test, n = 3 EPHA2 CAR T cells delivered intrathecally, n = 3 EPHA2 CARs T cells delivered IV for each dose range, centre lines show the mean ± SEM performed in triplicate. Infusion of 2.5×10⁶ EPHA2: Day 0 IV vs LV P=0.807, Day 30 IV vs LV P=0.00009, Day 60 IV vs LV P=0.07; 5.0×10⁶ EPHA2: Day 0 IV vs LV P=0.03, Day 30 IV vs LV P=0.00007, Day 60 IV vs LV P=0.001; 10×106 EPHA2: Day 0 IV vs LV P=0.003, Day 30 IV vs LV P=0.00007, Day 60 IV vs LV P=0.000015.