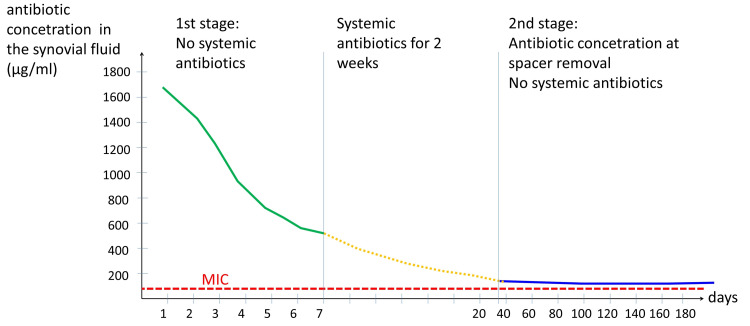
Figure 4. Schematic representation of the concentration of the antibiotic (vancomycin or aztreonam) in the synovial fluid after two-stage revision surgery for hip PJI.
The first part of the curve (green line) depicts the concentration of the antibiotic collected daily from the suction drain during the first postoperative week. The second part of the curve (orange dotted line) is hypothetical. It represents the concentration of the antibiotic during systemic antibiotic administration and during drug holiday. The third part of the curve (blue line) represents the concentration of the antibiotic in the synovial fluid, which was obtained by joint aspiration just before the second stage implantation. The red interrupted line is the MIC of the common microorganisms for the antibiotic. Burst release upon ALCS implantation and rapid drop of the concentration of the antibiotic is evident. Sustained release of antibiotic from the ALCS above the MIC of the microorganisms throughout the two-stage revision procedure is observed. Both antibiotics showed similar patterns of elution from the ACLS (Adapted from Hsieh et al. [24]).
MIC: Minimum inhibitory concentration, ALCS: Antibiotic-loaded cement spacer, PJI: Prosthetic joint infection.

