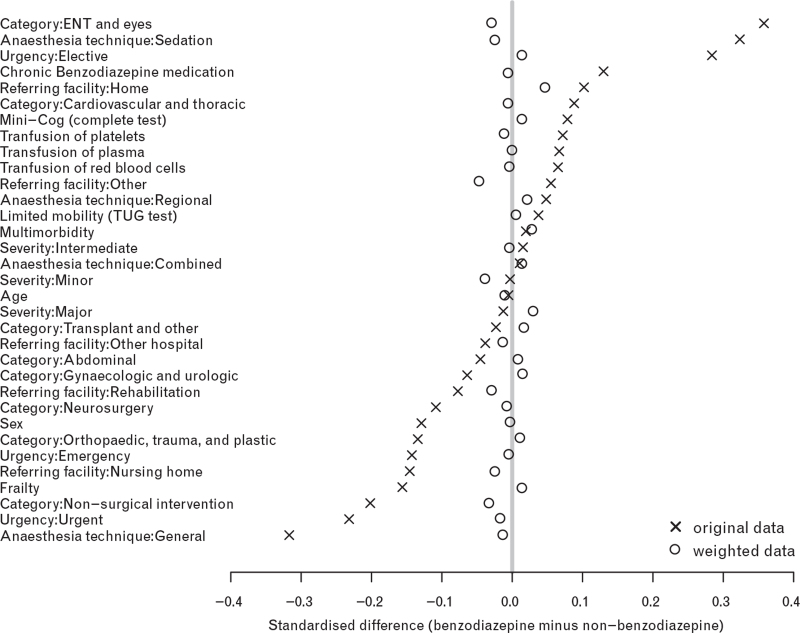
Fig. 1.
Standardised differences of the covariates included in the propensity score model
Standardised mean differences between the benzodiazepine-premedicated and nonbenzodiazepine-premedicated patients obtained from imputed data set 1. The crosses refer to the standardised differences in the original data set; the circles refer to the inverse-propensity-score-weighted standardised differences (see eMethods for the definition). The grey vertical line refers to a zero difference between the (weighted) means of the benzodiazepine-premedicated and nonbenzodiazepine-premedicated patients. Overall, the small distances between the circles and the reference line (all <10%) indicate a favourable balancing property of the fitted propensity score model.

