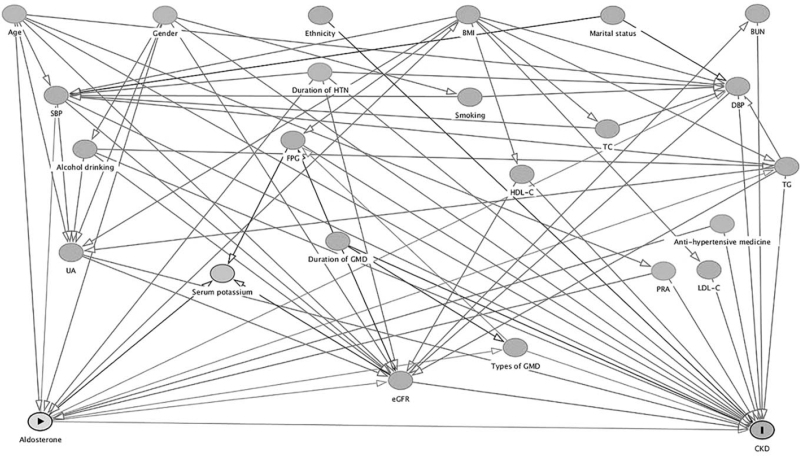
FIGURE 1.
Directed acyclic graph of causal assumptions. Nodes represent variables and arrows represent causal associations. Yellow-coloured and blue-coloured nodes indicates exposure and outcome, respectively. Gray-coloured nodes represent possible confounding factors. AGM, abnormal glucose metabolism; CKD, chronic kidney disease; eGFR, estimated glomerular filtration rate; FPG, fasting plasma glucose; HDL-C, high-density lipoprotein cholesterol; HTN, hypertension; LDL-C, low-density lipoprotein cholesterol; PRA, plasma renin activity; TC, total cholesterol; TG, triglyceride; UA, uric acid.

