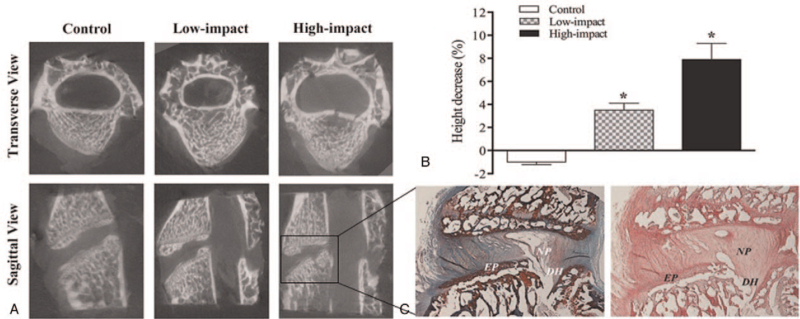
Figure 2.
Representative Micro-CT analysis for each group and the histological images of spinal segment with endplate fracture. A, The transverse and sagittal view of Micro-CT showed the endplate fracture of the spinal segment in the High-impact group; B, this graph showed the mean decrease of sample height between groups. The disc height in the High-impact group decreased significantly in comparison with that of the Control and Low-impact groups (∗P < 0.05 vs. Control and Low-impact groups); C, the representative H&E and safranin O staining of the vertebral endplate fracture in the High-impact group, combined with an osseous disc herniation. DH indicates disc height; EP, endplate; NP, nucleus pulposus.

