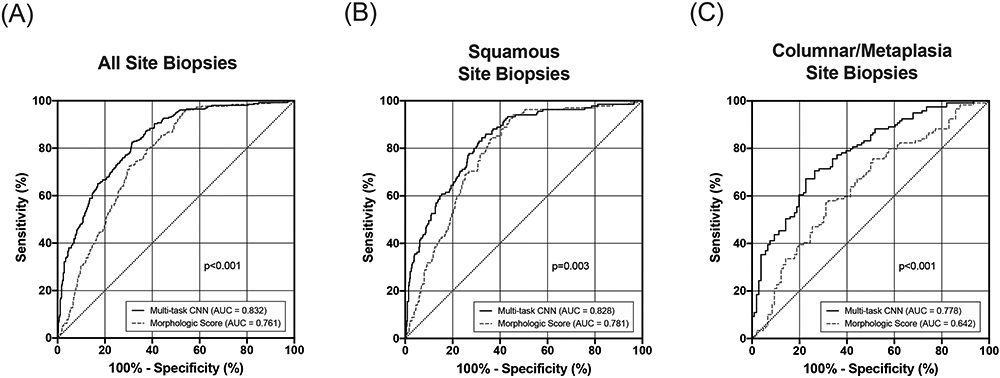
Figure 5: Diagnostic performance of HRME using morphologic image analysis and the multi-task CNN.

ROC analysis comparing CIN2+ detection using morphologic image analysis with the multi-task CNN. (A) ROC curves for all 789 images in the validation/test sets. (B) ROC curves for 559 images with a colposcopic impression of squamous tissue. (C) ROC curves for 225 images with a colposcopic impression of columnar tissue or metaplasia.
