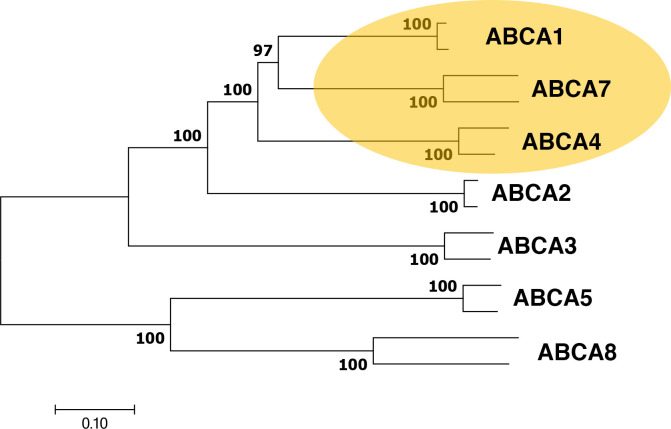
Fig 1. Phylogenetic relationships between mammalian ABC-A subfamily members.
The optimal tree is drawn to scale using mouse- and human- ABC-A sequences with branch lengths in the same units as those of the evolutionary distances used to infer the tree. Distances are in the units of the number of amino acids substitutions per site. The percentage of replicate trees in which the associated taxa clustered together in the bootstrap test using 500 replicates [37] and are shown at the branchpoints.

