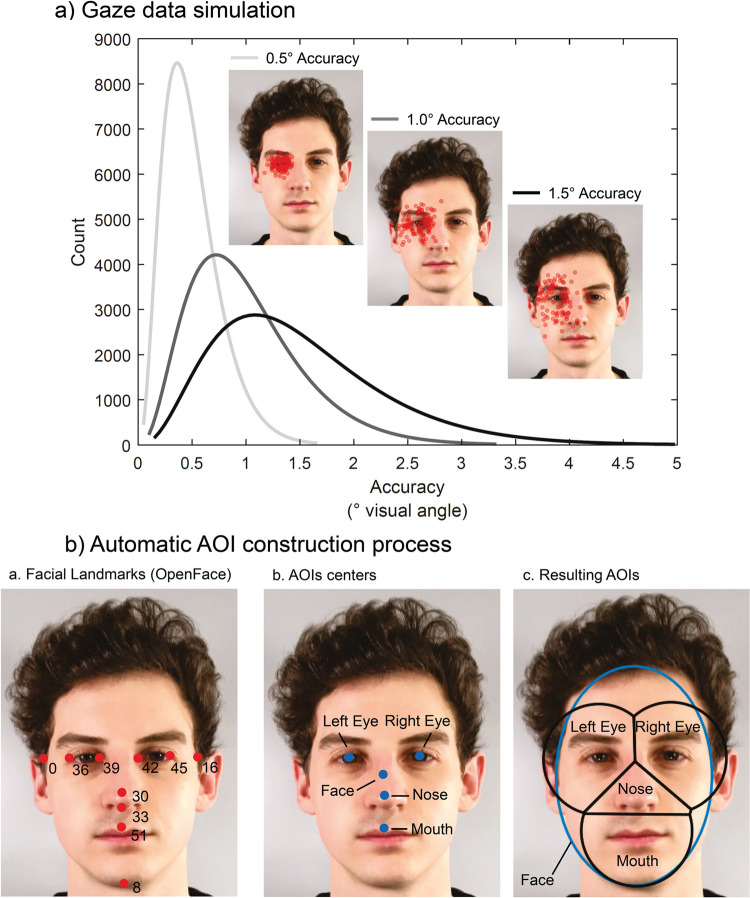
Fig 1. Visualization of gaze data simulation and areas of interest (AOI) definition.
(A) Visualization of the three gamma functions used to generate gaze data with three levels of accuracy (0.5°, 1.0° & 1.5°) and examples of the simulated fixations for the left eye of a facial stimulus as the facial target. Each red dot represents the averaged fixation location of 30 simulated fixations; a total of n = 100 data sets were simulated. (B) Visualization of the three steps of the automatic AOI construction process. 1. Facial landmarks from OpenFace. 2. AOI center points derived from the facial landmarks. 3. Resulting AOIs using the Limited-Radius Voronoi-Tessellation (LRVT) method (example with 2.0° radius). Note OF = OpenFace [19]. The stimulus shown in A and B was created for illustrative purposes only and is not part of the stimulus set used in the study (see Methods section).

