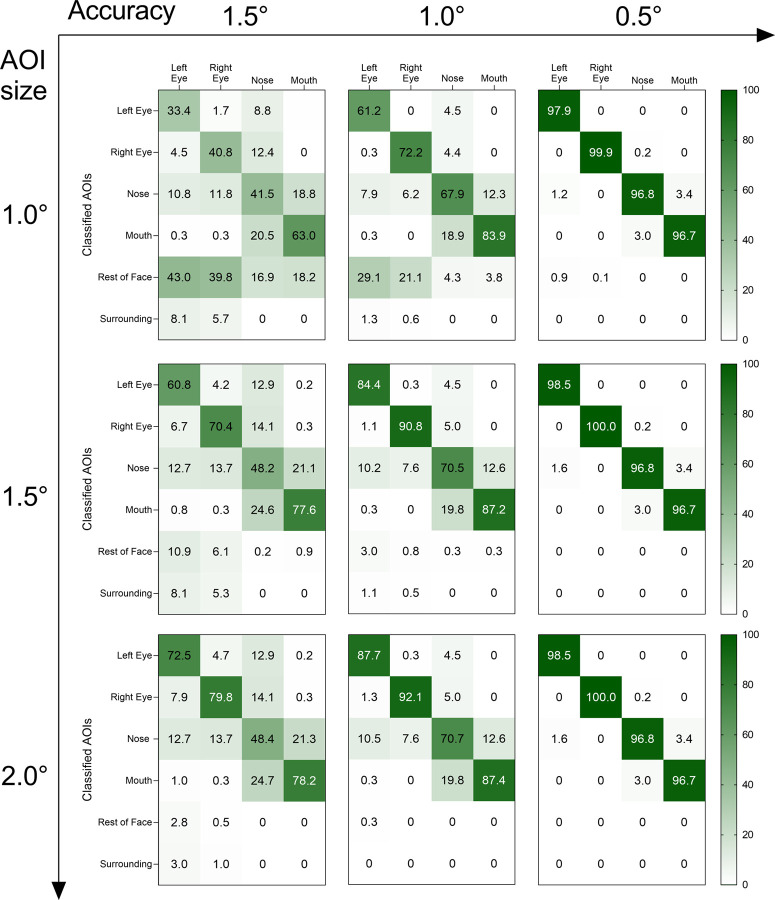
Fig 2. Confusion matrices of the fixation classification performance as a function of gaze data accuracy and AOI size.
The percentages in the diagonal represent correctly classified fixation points, while the percentages outside the diagonal represent misclassified fixation points. The percentages in the last two rows correspond to the number of unclassified fixation points (rest of face & surrounding).

