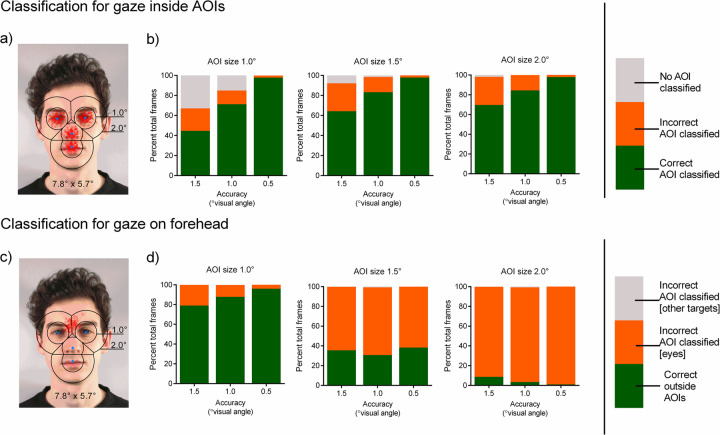
Fig 3. Effect of gaze data accuracy and AOI size on classification performance of simulated fixations (on eyes, nose & mouth) averaged over all facial AOIs.
(A) Visualization of the AOI sizes 1.0° and 2.0° drawn around the blue center points and the simulated fixation points in red (n = 100, averaged over 30 simulated fixations; accuracy 0.5°). (B) Green indicates correct classification within the corresponding AOI, orange and gray indicate misclassifications as fixations within the other AOIs, or no AOI at all. Effect of gaze data accuracy and AOI size on classification performance of simulated fixations (on the forehead). (C) Visualization of AOIs with 1.0° and 2.0° radius and the simulated fixation points on the forehead in red (n = 100, averaged over 30 simulated fixations; accuracy 0.5°). (D) Green indicates the correct classification outside any AOI, orange and gray indicate misclassifications as fixations within the AOIs of the eye region or within the other AOIs. The stimulus shown in A and C was created for illustrative purposes only and is not part of the stimulus set used in the study (see Methods section).

