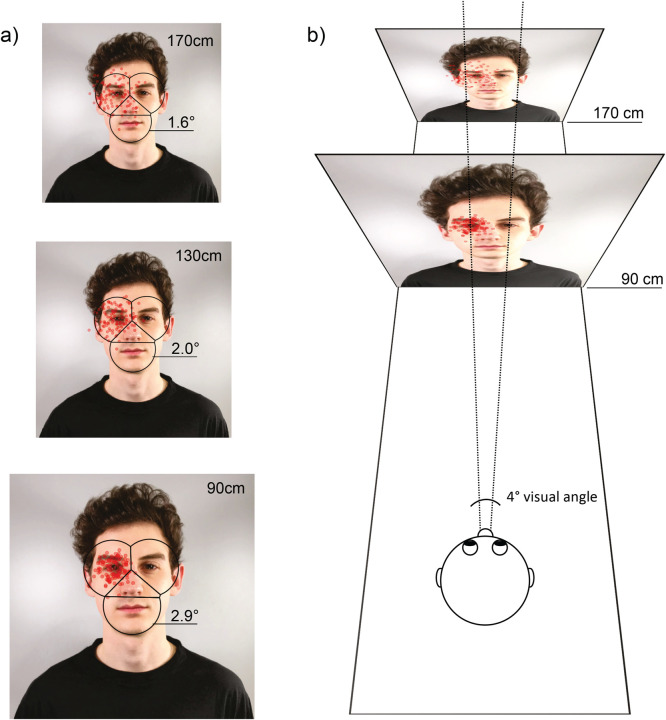
Fig 5. Effect of viewing distance on stimulus size and fixation point deviation.
(A) Visualization of the stimulus size over three viewing distances (90cm, 130cm & 170cm) with AOIs covering the same facial areas (radius 4.6cm; in visual degree angle: 1.6°, 2.0° & 2.9°) and simulated fixation points on the left eye. (B) Visualization of the interaction between visual angle and viewing distance on fixation point deviation. In both figures (A & B) each red dot represents the averaged fixation location of 30 simulated fixations with an accuracy of 1.5°; a total of n = 100 data set were simulated. The stimulus shown in A and B was created for illustrative purposes only and is not part of the stimulus set used in the study (see Methods section).

