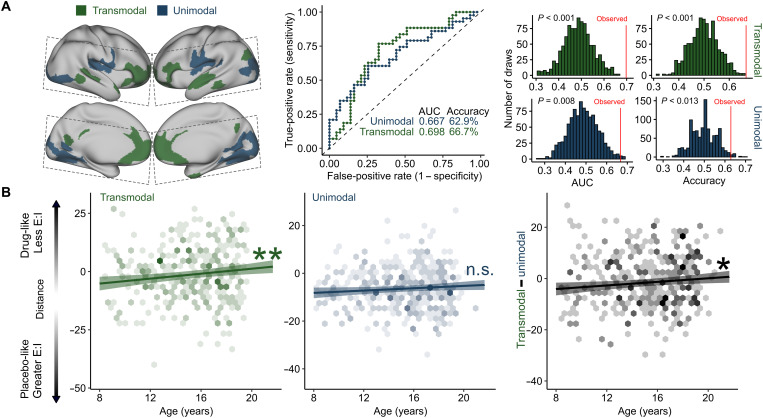
Fig. 4. Transmodal areas undergo E:I ratio development during adolescence.
(A) Model performance for unimodal and transmodal classifiers. SVM classifiers were trained and validated for connections to the most transmodal (green) and most unimodal (blue) areas only. Dashed lines indicate acquisition field of view for the phMRI dataset. Both models performed significantly better than a permuted null distribution (middle: receiver operating characteristic curves for each model; right: null distributions from 1000 null permutations). (B) Models trained on transmodal and unimodal data were applied to the developmental dataset, generating a distance metric for each participant where greater values represent patterns of functional connectivity consistent with a lower E:I ratio. Individuals had a lower estimated E:I ratio with age in transmodal cortex (left) but not in unimodal cortex (middle). This pattern was confirmed by a significant effect of age on within-subject change in transmodal versus unimodal distance scores (right). *P < 0.05 and **P < 0.01.

