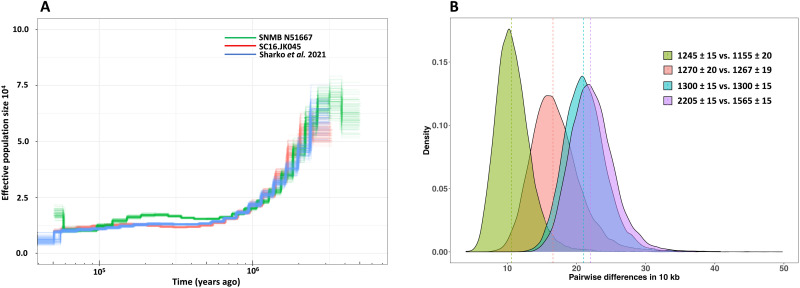
Fig. 3. Steller’s sea cow’s population history.
(A) Inferred effective population size trajectories for three Steller’s sea cow individuals. All three trajectories show a consistent decrease in population size from at least 500,000 years ago. (B) Pairwise differences between individuals are estimated as the average number of differences per 10 kbp in nonoverlapping 50-kbp regions in 10,000 randomly chosen blocks. The amount of divergence between individuals declines over time (section SM4). The vertical dashed lines correspond to the median of the number of pairwise differences per 10 kbp. Numbers on the graph represent the 14C uncalibrated date (years B.P.).

