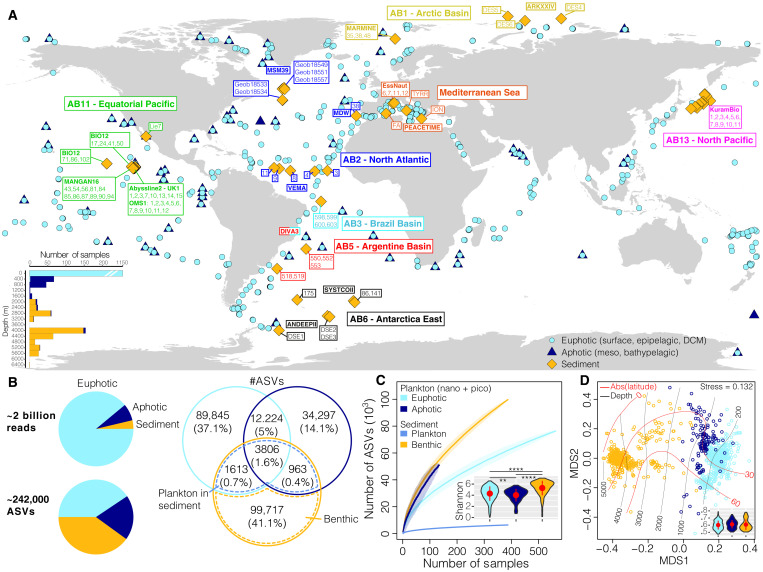
Fig. 1. Eukaryotic ribosomal DNA diversity in the pelagic euphotic and aphotic zones and in the deep-ocean surficial sediment.
(A) Location of the stations (n = 447) from which the samples (n = 1685) analyzed in this study were collected. The color of the sediment sampling station tags indicates approximate correspondence with abyssal provinces (42), and the names of deep-sea cruises are indicated in bold or within text boxes. The bottom left inset represents the depth distribution (in meters) of the samples. (B) Number of eukaryotic 18S V9 rDNA reads and of amplicon sequence variants (ASVs). A Venn diagram represents the distribution of ASV richness and their proportions within and across realms. The intersection of the pelagic and sediment datasets is used here to separate the indigenous benthic organisms from the sinking plankton (see Materials and Methods). (C) ASV accumulation curves as a function of sampling effort. For pelagic realms, we calculated the curves by focusing only on the nano- and picoplanktonic size fractions (see Materials and Methods). The inset displays the distribution of Shannon diversity for pelagic and benthic communities. The red dots and bars within violin plots represent means and SDs, and horizontal bars indicate significant differences (Wilcoxon tests, **P < 0.01 and ****P < 0.0001). (D) Nonmetric multidimensional scaling (NMDS) analysis of the Bray-Curtis dissimilarity matrix computed from the pelagic (only the nano- and pico-fractions) and sediment datasets. The red and black lines on the ordination represent, respectively, the absolute latitude and depth as fitted surfaces to the ordination. The inset represents the community dispersion within each realm (i.e., Bray-Curtis distances to the group centroid, higher values indicate more compositional variation). The red dots and bars within violin plots represent means and SDs, respectively, and no significant differences between realms were detected (Wilcoxon tests, P > 0.05).

