(
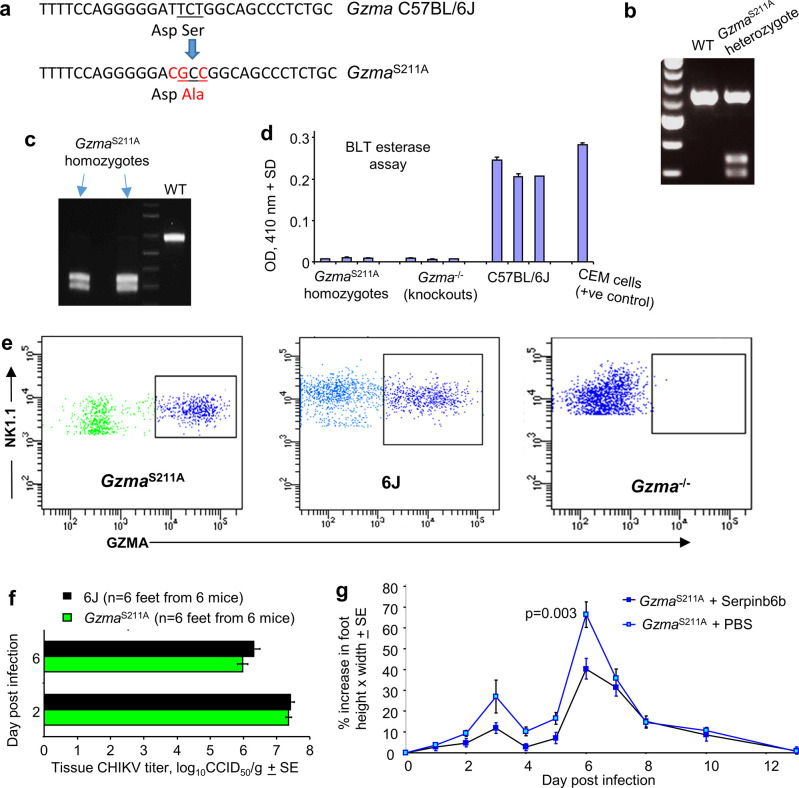
a) The
GzmaS211A mouse was generated by CRISPR of C57BL/6J mice by the Australian Phenomics Network (APN), Monash University, Melbourne, Australia. (
b) Genotyping was undertaken at APN using F 5′
TCAGCTGCTTTTGCCTGTTTCA 3′ and R 5′
GAGAAAGTCCCCTGTCC-TCGG 3′ primers to generate a 628 bp product, with BsaHI digestion (blue arrow in
a) generating 290 bp and 338 bp fragments for the
GzmaS211A allele. (
c) Heterozygous
GzmaS211A mice were interbred to generate homozygous
GzmaS211A mice at QIMR Berghofer MRI. The undigested 628 bp PCR products were sequenced to confirm that the correct product had been amplified. (
d) Mouse splenic NK cells constitutively express active GZMA protein. NK cells from spleens were FACS sorted (NK1.1+, CD3-) and lysates analyzed by the benzyloxycarbonyl-L-lysine thiobenzylester (BLT) esterase activity in duplicate as described (
Schanoski et al., 2019). (
e) NK cells (NK1.1+, CD3-) from spleens from the indicated mouse strains were analyzed by FACS for mouse GZMA expression using intracellular anti-GZMA antibody staining as described (
Schanoski et al., 2019). (
f)
GzmaS211A and 6J mice were infected with chikungunya virus (CHIKV) and tissue viral titers in the feet determined as described (
Gardner et al., 2010). (
g) Treatment of CHIKV-infected mice with Serpinb6b as described previously (
Wilson et al., 2017) except using
GzmaS211A mice. Statistics (day 6) by
t-test n = 12 feet from six mice per group.


