. 2022 Feb 4;11:e70207. doi: 10.7554/eLife.70207

Figure 4. 6NNnt8-12 mice.

(a) 6NNnt8-12 mice have the same Nnt exon deletion as 6J mice. Age-matched female 6NNnt8-12, 6N, and 6J mice were infected with chikungunya virus (CHIKV) and foot swelling measured over time (n = 5 mice and 10 feet per group). Foot swelling was significantly higher in 6NNnt8-12 mice when compared with 6N mice on days 2–7 (day 2 p=0.0026, day 7 p=0.0027, t-tests, parametric data distributions; days 3–6 p=0.003, Kolmogorov–Smirnov tests, nonparametric data distributions). Foot swelling was significantly lower in 6N mice when compared with 6J mice (day 2 p=0.042, day 6 p=0.001, day 7 p=0.0005, t-tests, parametric data distributions; days 3 and 5, p=0.002, Kolmogorov–Smirnov tests, nonparametric data distributions). (b) Viremia for the same mice as in (a). (c) H&E staining of feet from 6NNnt8-12 and 6N mice day 6 post infection showing subcutaneous edema (*). (d) Percentage of foot section area showing overt subcutaneous edema (statistics by Kolmogorov–Smirnov test). (e) RNA-Seq data for four comparisons was analyzed by Ingenuity Pathway Analysis (IPA) and cytokine upstream regulator (USR) overlaps shown. Only cytokine USRs with positive z-scores associated with increased foot swelling are shown.

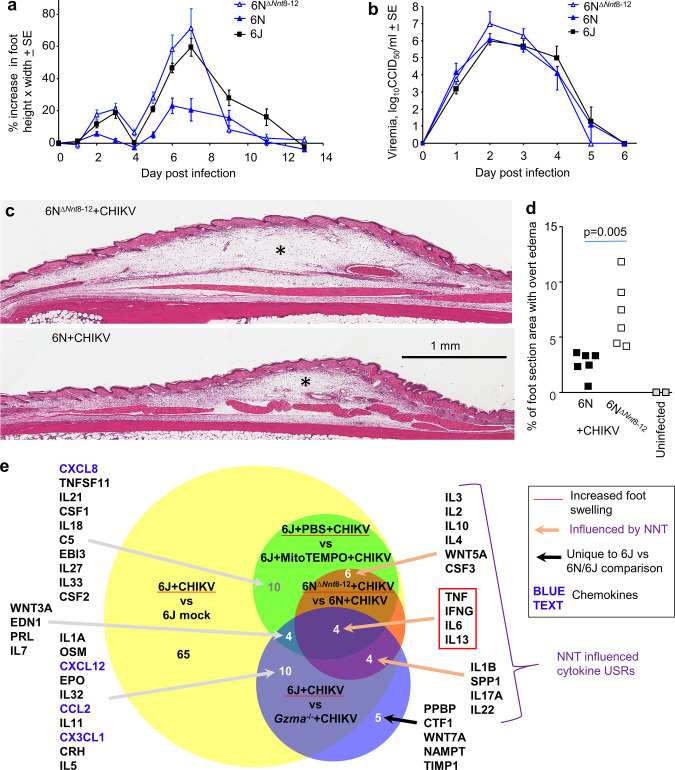
Figure 4.

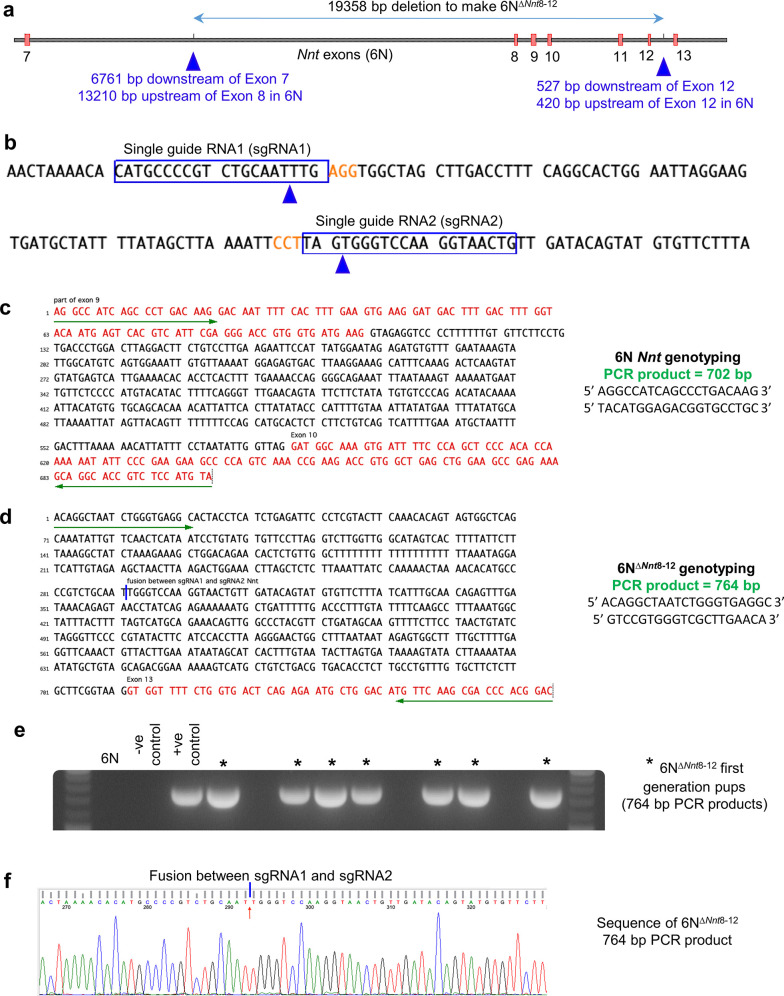
Figure 4—figure supplement 1. Generation of 6NNnt8-12 mice.

Figure 4—figure supplement 1.

(a) Deletion of exons 8–12 from the 6N Nnt gene. (b) sgRNAs and location of cuts (blue arrowheads). (c) Primers for genotyping 6N Nnt allele. (d) Primers for genotyping 6NNnt8-12 allele. (e) Example of 764 bp PCR products for first-generation 6NNnt8-12 pups. (f) Example of sequencing 764 bp PCR product. Mice were bred to homozygosity to produce 6NNnt8-12 mice.
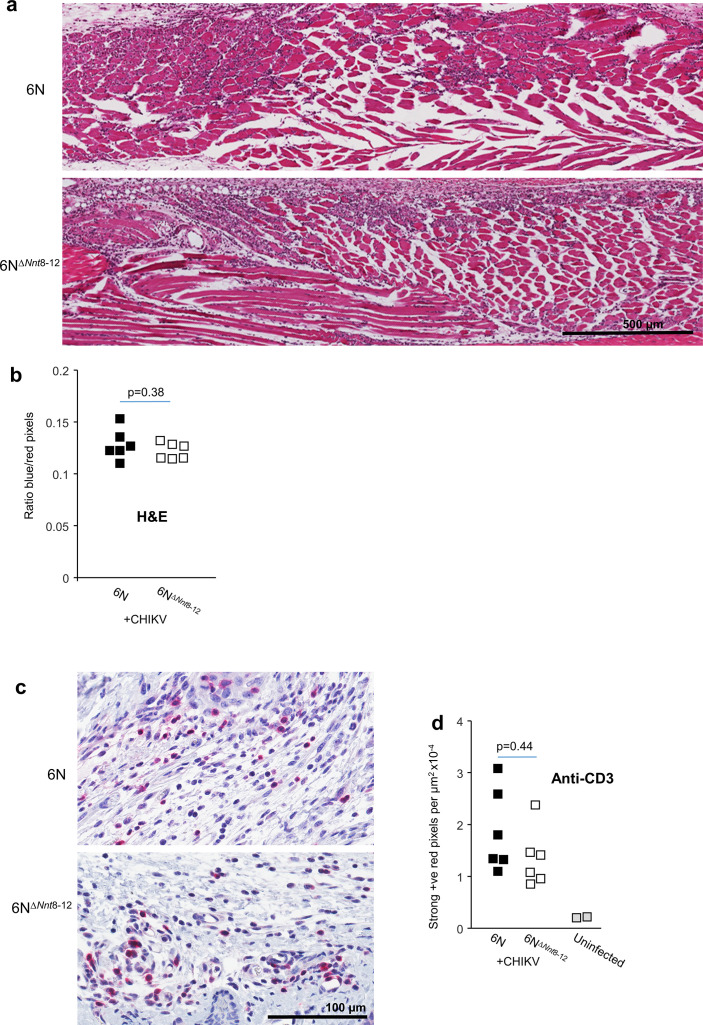
Figure 4—figure supplement 2. Histological analyses for 6NNnt8-12 mice feet.

Figure 4—figure supplement 2.

(a) Examples of H&E staining of feet showing the prominently mononuclear cellular infiltrates (purple) in muscle tissues. (b) Quantitation of H&E staining of feet using blue (nuclei) over red (cytoplasm) pixel count ratios determined by Aperio pixel count. Six sections total from two independent H&E staining rounds were averaged to produce one value per mouse (n = 6 mice per group). Statistics by t-test. (c) Examples of anti-CD3 immunohistochemistry staining in foot sections (Warp red with toluidine blue counterstain). (d) Quantitation of anti-CD3 staining by Aperio pixel count. Three sections were averaged to produce one value per mouse (n = 6 mice per group). Area (denominator) was normalized (mean factor of 1.18) to account for the increased area associated with edema in the 6NNnt8-12 group. Statistics by Kolmogorov–Smirnov test (nonparametric–high kurtosis). Remains nonsignificant even without normalization.