. 2022 Feb 4;11:e70207. doi: 10.7554/eLife.70207

Figure 6. Polyinosinic:polycytidylic acid (poly(I:C)) injection into GzmaS211A, 6J mice, and Ifnar-/-.

(a) GzmaS211A, 6J, and Ifnar-/- mice were injected i.v. with 250 µg of poly(I:C) in 150 µl of PBS, and serum samples were taken at the indicated times and assayed for GZMA concentration using a capture ELISA kit (6J n = 5–8, Ifnar-/- n = 5–6 and GzmaS211A n = 3 mice per time point). (b) GzmaS211A and 6J mice were injected i.v. with 250 µg of poly(I:C) and feet removed 6 hr later and analyzed by RNA-Seq. The differentially expressed genes (DEGs) (Supplementary file 6b) were analyzed by Cytoscape and Ingenuity Pathway Analysis (IPA). The full gene list (Supplementary file 6a) was analyzed using the Molecular Signature Database (MSigDB).

Figure 6.

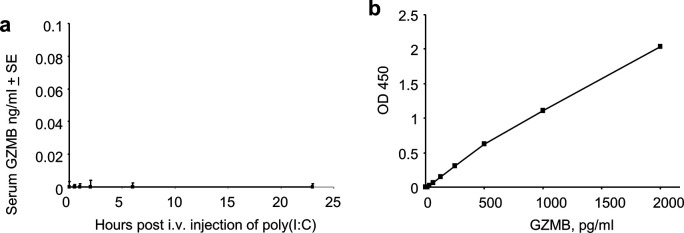
Figure 6—figure supplement 1. Serum granzyme B (GZMB) levels after i.v. injection of polyinosinic:polycytidylic acid (poly(I:C)).

Figure 6—figure supplement 1.

(a) 6J mice were injected i.v. with 250 µg of poly(I:C) and serum samples taken at the indicated times and assayed for GZMB concentrations by capture ELISA (MyBioSource, San Diego, CA; MBS453704) (n = 5 mice per time point). (b) Standard curve.
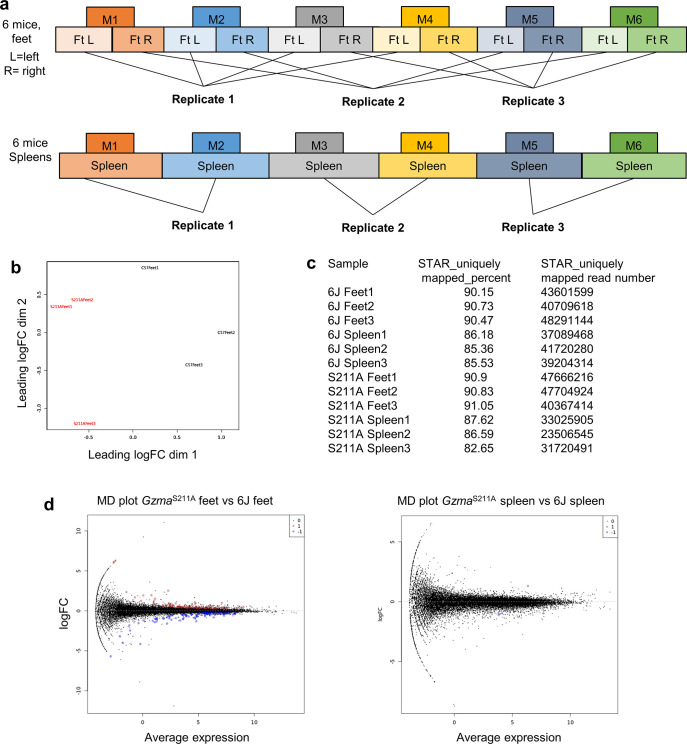
Figure 6—figure supplement 2. RNA-Seq for polyinosinic:polycytidylic acid (poly(I:C)) injection into GzmaS211A vs. 6J mice.

Figure 6—figure supplement 2.

(a) Pooling strategy for RNA derived from six mice 6 hr after i.v. poly(I:C) injection. (b) Multi-dimensional scaling (MDS) plot for RNA-Seq data for GzmaS211A vs. 6J feet, illustrating clear segregation of the three replicates for each mouse strain. (c) STAR read mapping data showing high percentage and number of unique mapping reads. (d) Mean-difference (MD) plots. Red, upregulated differentially expressed genes (DEGs); blue, downregulated DEGs.
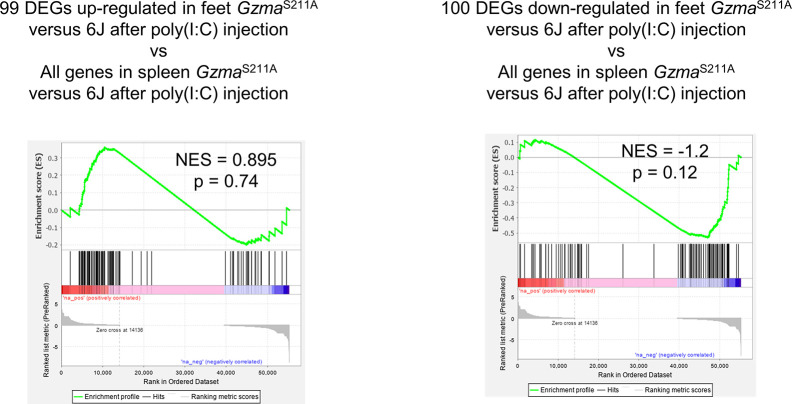
Figure 6—figure supplement 3. The gene expression signatures in feet seen 6 hr after injection of polyinosinic:polycytidylic acid (poly(I:C)) in GzmaS211A vs. 6J mice are not significantly recapitulated in spleen.

Figure 6—figure supplement 3.

Genes were preranked by fold change.
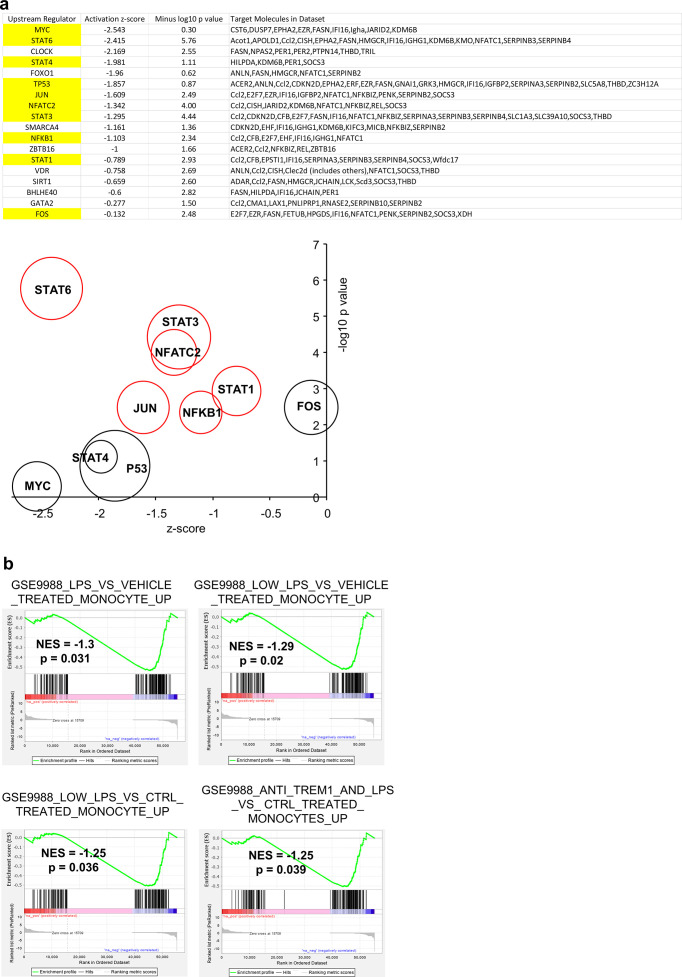
Figure 6—figure supplement 4. Ingenuity Pathway Analysis (IPA) and Gene Set Enrichment Analysis (GSEA) for polyinosinic:polycytidylic acid (poly(I:C)) injection into GzmaS211A vs. 6J mice.

Figure 6—figure supplement 4.

(a) IPA upstream regulator (USR) analysis (direct only) for 199 feet differentially expressed genes (DEGs) from Supplementary file 6b (for GzmaS211A vs. 6J). This analysis largely restricts the output to transcription factors. The transcription factors with well-known inflammation and immune functions are highlighted in yellow and are plotted on the bubble graph. Red circles indicate transcription factors where the -log10 p-value > 2 and z-score < -0.75. The USRs are downregulated in GzmaS211A mice (negative z-score) and are thus upregulated by proteolytically active granzyme A (GZMA) in 6J mice. (b) Interrogation of the Molecular Signature Database (http://www.gsea-msigdb.org/gsea/msigdb/index.jsp) identified DEGs listed for GSE19888 as showing significant enrichment in the downregulated genes in GzmaS211A feet (Supplementary file 6h; preranked by fold change). Thus, DEGs upregulated in activated monocytes were significantly enriched in the genes upregulated in 6J mice by GZMA.