. 2022 Jan 18;11:e69709. doi: 10.7554/eLife.69709

Figure 1. PIKfyve positively regulates cell migration in part via regulation of cell surface levels of β1-integrin.

(A–B) Inhibition of PIKfyve delays cell migration. (A) Wound healing was assessed in HeLa cells following a 27 hr incubation in the presence of either DMSO, 1 µM apilimod, or 0.8 µM YM201636. (B) Percentage of wound closure was quantified. Bar: 100 µm. (C–D) Increasing PIKfyve activity promotes cell migration. (C) Wound healing assays were performed in Flp-in HEK293T cells stably expressing doxycycline-inducible wild-type PIKfyve or hyperactive PIKfyve-KYA in the presence of 100 ng/ml doxycycline for 12 hr. (D) Percentage of wound area closure was quantified. Bar: 100 µm. (E–G) Inhibition of PIKfyve decreases the surface levels of β1-integrin. (E) HeLa cells treated with DMSO or 1 µM apilimod for 1 hr were incubated with antibodies to label surface β1-integrin for 1 hr at 4°C and fixed at 4°C. (F) Intensity of β1-integrin per cell was quantified and normalized to the average intensity of the DMSO treatment for that particular experiment. Bar: 20 µm. (G) HeLa cells treated with DMSO or 1 µM apilimod for 1 hr were incubated with antibodies to label surface β1-integrin for 1 hr at 4°C followed by incubation with 488 Alexa-Fluor-conjugated secondary antibodies for 30 min at 4°C. Cells were fixed and 10,000 cells were analyzed per experiment by flow cytometry. The mean intensity of surface β1-integrin was measured and values normalized to DMSO treatment. (H–I) Increasing PIKfyve activity elevates the surface levels of β1-integrin. (H) HeLa cells either untransfected or transiently transfected with 6xHA-PIKfyve or 6xHA-PIKfyve-KYA incubated for 1 hr at 4°C with antibodies to label surface β1-integrin. Cells were fixed, permeabilized, immunostained with an anti-HA antibody and corresponding Alexa-Fluor-conjugated secondary antibodies. (I) Intensity of β1-integrin per cell was quantified and the values were normalized to the average intensity of untransfected cells for each experiment. Bar: 20 µm. Data presented as mean ± SE. Statistical significance from three independent experiments were determined using unpaired two-tailed Student’s t-test (F) or paired two-tailed Student’s t-test (G) or one-way ANOVA and Dunnett’s (B) or Tukey’s (D,I) post hoc tests. Yellow lines indicate the migration front. *p < 0.05, **p < 0.01, ***p < 0.005, ****p < 0.001, and ns, not significant.

Figure 1—source data 1. Contains numerical source data for Figure 1.

Figure 1.

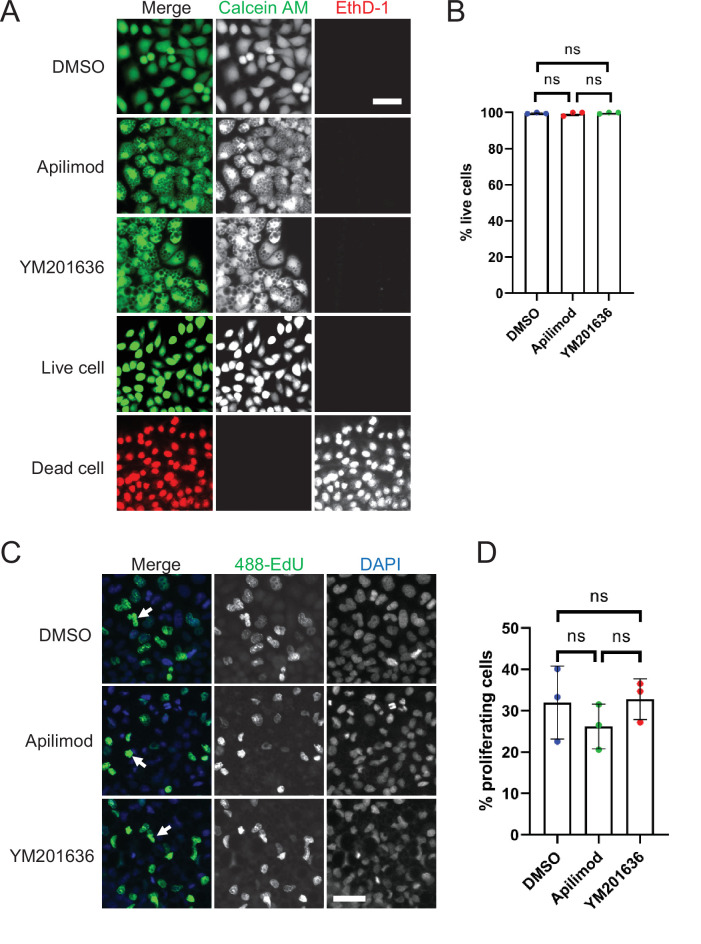
Figure 1—figure supplement 1. Inhibition of PIKfyve does not affect cell viability or proliferation.

Figure 1—figure supplement 1.

(A–B) Cell viability was assessed for HeLa cells that were either treated with DMSO, 1 µM apilimod, or 0.8 µM YM201636 for 27 hr. Untreated cells and cells treated with methanol for 20 min were used as live and dead cell controls, respectively. Percentage of live cells was quantified. (C) Cell proliferation was measured in HeLa cells treated with DMSO, 1 µM apilimod, or 0.8 µM YM201636 for 27 hr. (D) The percentage of proliferating cells in (C) was quantified. Data presented as the mean ± SE. Statistical significance from three independent experiments was analyzed using one-way ANOVA and Tukey’s post hoc tests (B, D). ns, not significant. Bar: 100 µm.
Figure 1—figure supplement 1—source data 1. Contains numerical source data for Figure 1—figure supplement 1.
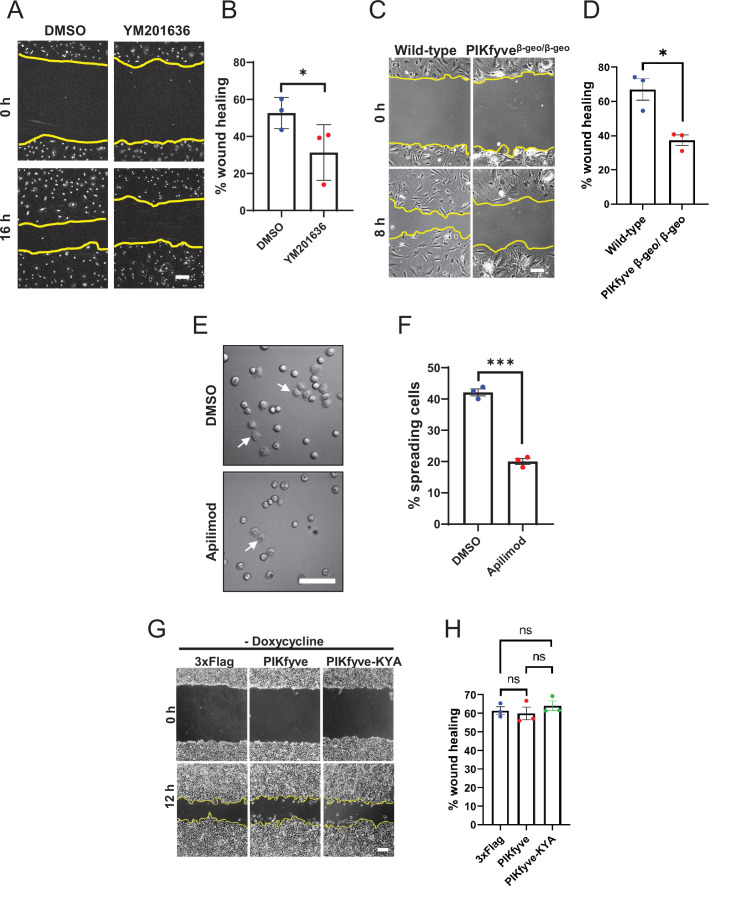
Figure 1—figure supplement 2. PIKfyve is required for cell migration and cell adhesion.

Figure 1—figure supplement 2.

(A–D) PIKfyve is required for cell migration. (A) Wound healing assays were performed on primary neonatal cardiac fibroblasts in the presence of DMSO or 0.8 µM YM201636 for 16 hr. (B) Percentage of wound closure was quantified. (C) Wound healing assays were performed for 8 hr on primary mouse embryonic fibroblast (MEF) cells derived from wild-type and hypomorphic PIKfyveβ-geo/β-geo mice. (D) Percentage of wound area closure was quantified. (E–F) PIKfyve is required for cell spreading. (E) HeLa cells were trypsinized, seeded in media containing either DMSO or 1 µM apilimod and incubated for 1 hr. Arrows indicate examples of cells that exhibited spreading. (F) Percentage of cells that spread onto the surface were quantified. (G–H) Cell migration is not elevated when there is no induction of the hyperactive mutant of PIKfyve. Wound healing assays were performed on HEK293T cells stably expressing doxycycline-inducible wild-type PIKfyve or hyper-active PIKfyve-KYA in the absence of doxycycline for 12 hr. Percentage of wound area closure was quantified. Yellow lines indicate the migration front. Data presented as mean ± SE. Statistical significance from three independent experiments was determined using paired two-tailed Student’s t-Test (B, D, F) or one-way ANOVA and Tukey’s post hoc tests (H). ***p < 0.005, *p < 0.05, and ns, not significant. Bar: 100 µm. Error bar, SE.
Figure 1—figure supplement 2—source data 1. Contains numerical source data for Figure 1—figure supplement 2.
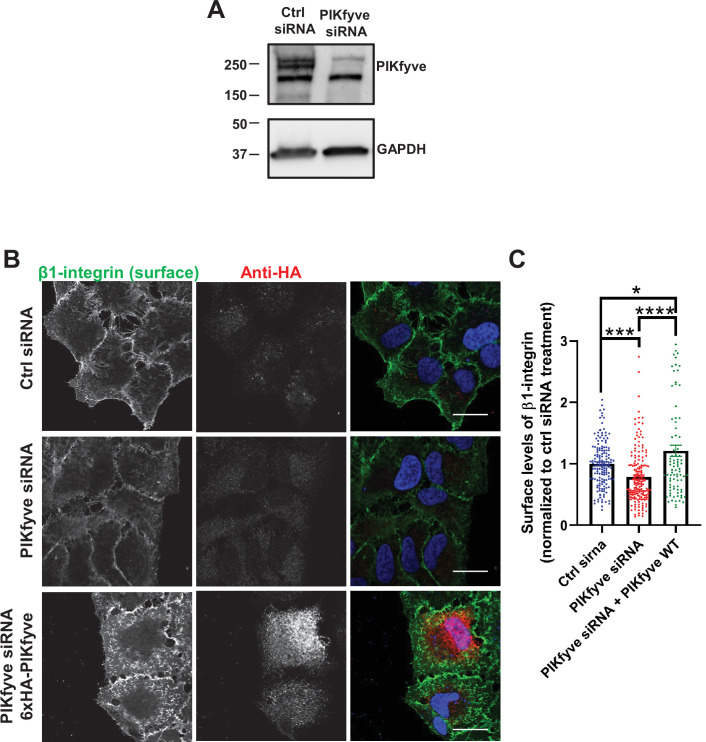
Figure 1—figure supplement 3. Depletion of PIKfyve results in a decrease of the surface levels of β1-integrins.

Figure 1—figure supplement 3.

(A) HeLa cells were transfected with PIKfyve siRNA; PIKfyve siRNA that targets the 5’UTR region of PIKfyve was used. As a control, cells were transfected without oligos. After 3 days, cells were lysed and immunoblotted with antibodies to PIKfyve and GAPDH. (B) Expression of siRNA-resistant PIKfyve rescues the surface levels of β1-integrins. HeLa cells transfected with PIKfyve siRNA or no siRNA for 3 days were either untransfected or transfected with 6xHA-PIKfyve for the last 18 hr of transfection. Cells were then incubated with antibodies to β1-integrins for 1 hr at 4°C. Cells were fixed for 30 min at 4°C and analyzed by immunofluorescence. Bar: 20 µm. (C) The intensity of β1-integrin was quantified per cell and the values were normalized to the DMSO treatment. Data presented as mean ± SE. Statistical significance from three independent experiments were quantified with one-way ANOVA followed by Tukey’s post hoc. *p < 0.05, ***p < 0.005, and ****p < 0.001.
Figure 1—figure supplement 3—source data 1. Contains numerical and uncropped western blot source data for Figure 3—figure supplement 1.