. 2022 Jan 18;11:e69709. doi: 10.7554/eLife.69709

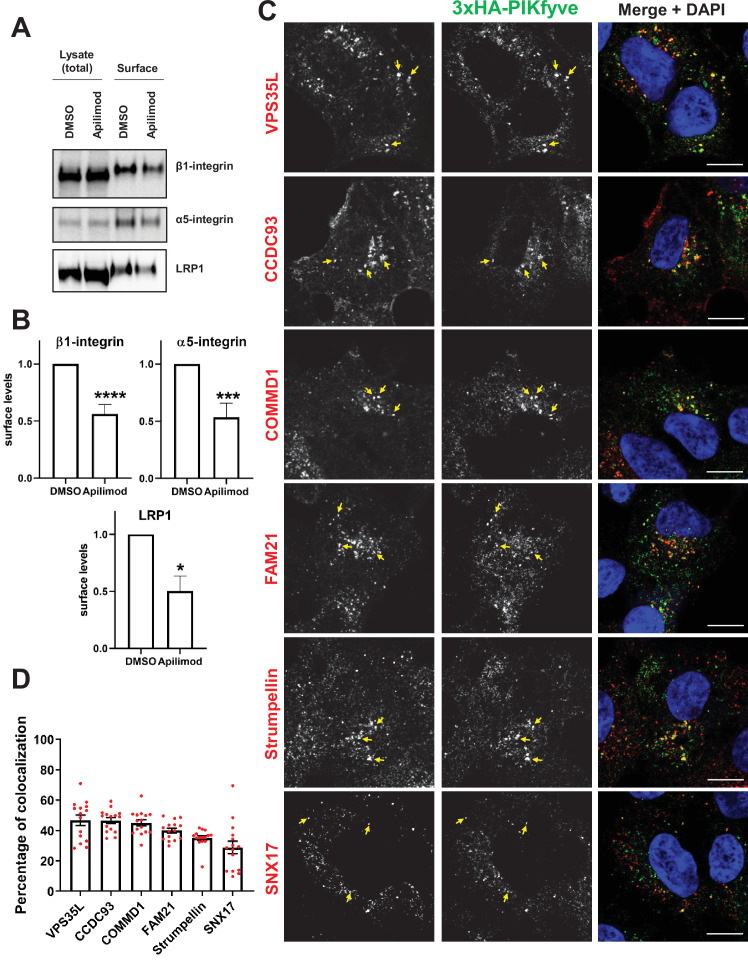
Figure 6. PIKfyve regulates the recycling of SNX17-Retriever-CCC-WASH cargoes and colocalizes with SNX17 and subunits of the Retriever, CCC, and WASH complexes.

(A) HeLa cells were treated with DMSO or 1 µM apilimod for 1 hr and then the levels of SNX17 cargoes, β1-integrin, and α5-integrin were determined using a surface biotinylation assay. Surface biotinylation assay was similarly performed on HUH7 cells and low-density lipoprotein receptor-related protein 1 (LRP1) levels were measured. (B) Quantification of western blots from three independent surface biotinylation experiments. (C) HEK293 cells expressing 3xHA-endogenously tagged PIKfyve were fixed, permeabilized, and incubated with antibodies against the HA tag and antibodies against either SNX17, the Retriever complex subunit (VPS35L), CCC complex subunits (CCDC93 and COMMD1), or WASH complex subunits (FAM21 and Strumpellin). Bar: 10 µm. Arrows indicate examples of puncta showing colocalization. (D) The percentage of PIKfyve colocalizing with the indicated proteins was determined using Mander’s colocalization coefficient analysis from three independent experiments. Data presented as mean ± SE. *p < 0.05, ***p < 0.005, and ****p < 0.001.

Figure 6—source data 1. Contains numerical and uncropped western blot source data for Figure 6.

Figure 6.

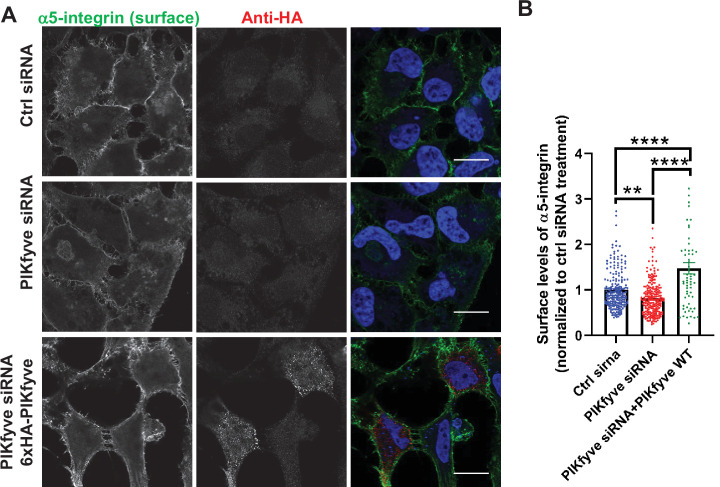
Figure 6—figure supplement 1. Depletion of PIKfyve results in a decrease of the surface levels of α5-integrins.

Figure 6—figure supplement 1.

(A) Expression of siRNA-resistant PIKfyve rescues the surface levels of α5-integrins. HeLa cells transfected with PIKfyve siRNA or no siRNA for 3 days were either untransfected or transfected with 6xHA-PIKfyve for the last 18 hr of transfection. Cells were then incubated with antibodies to α5-integrins for 1 hr at 4°C. Cells were fixed for 30 min at 4°C and analyzed by immunofluorescence. Bar: 20 µm. (B) The intensity of α5-integrin was quantified per cell and the values were normalized to the DMSO treatment. Data presented as mean ± SE. Statistical significance from three independent experiments was quantified with one-way ANOVA followed by Tukey’s post hoc. **p < 0.01 and ****p < 0.001.
Figure 6—figure supplement 1—source data 1. Contains numerical source data for Figure 6—figure supplement 1.
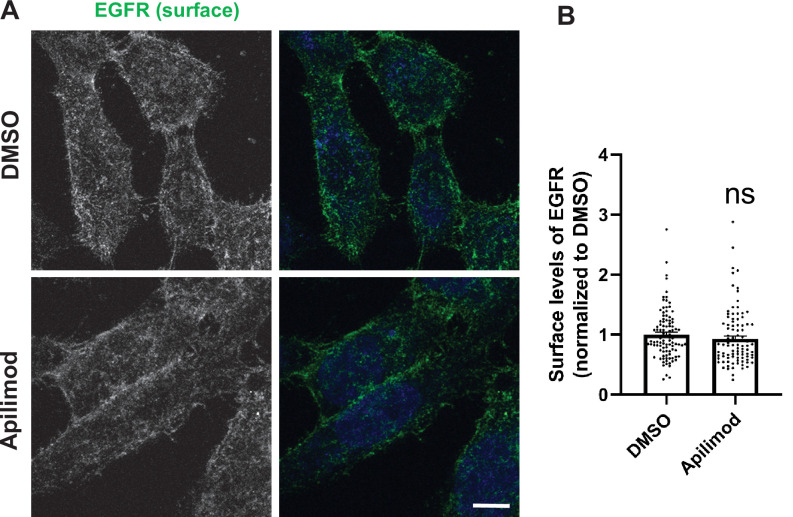
Figure 6—figure supplement 2. Inhibition of PIKfyve does not alter the surface levels of EGFR.

Figure 6—figure supplement 2.

(A) HeLa cells were treated with DMSO or 1 µM apilimod for 1 hr, followed by incubation with antibodies to label the surface EGFR for 1 hr at 4°C. Cells were fixed at 4°C for 30 min and analyzed by immunofluorescence. Bar: 10 µm. (B) Intensity of surface EGFR per cell was quantified and the values were normalized to the average intensity of the DMSO treatment. Data presented as mean ± SE. Statistical significance from three independent experiments were determined by unpaired two-tailed Student’s t-test. ns, not significant.
Figure 6—figure supplement 2—source data 1. Contains numerical source data for Figure 1—figure supplement 2.
Figure 6—figure supplement 3. Immunofluorescence localization of endosomal proteins in unedited HEK293 cells (control for Figure 6).

Figure 6—figure supplement 3.

HEK293 cells were fixed, permeabilized, and incubated with antibodies against HA and against markers for either the retromer (VPS35), SNX17, the Retriever subunit, VPS35L, the CCC complex subunits, COMMD1 and CCDC93, or the WASH complex subunits, Strumpellin and FAM21. Bar: 10 µm.