. 2022 Jan 18;11:e69709. doi: 10.7554/eLife.69709

Figure 7. CCC and Retriever complexes require PI3,5P2 and/or phosphatidylinositol 5-phosphate (PI5P) to bind to endosomes.

(A) HeLa cells treated with either DMSO or 1 µM apilimod or co-treated with 1 µM apilimod and 0.01 µM VPS34-IN1 for 30 min were fixed, permeabilized and co-stained with antibodies against VPS35 (A–D) and antibodies against either VPS35L, COMMD1, FAM21, or SNX17. (B) A mask of VPS35-positive endosomes was generated, and the intensity of VPS35L, COMMD1, FAM21, and SNX17 within this location was quantified. Values were normalized to the corresponding average intensity of the DMSO treatment cohort. Data presented as mean ± SE. Statistical significance from three or more independent experiments as indicated within bar graph were analyzed using one-way ANOVA and Tukey’s post hoc tests. ***p < 0.005 and ****p < 0.001, and ns, not significant. Bar: 10 µm.

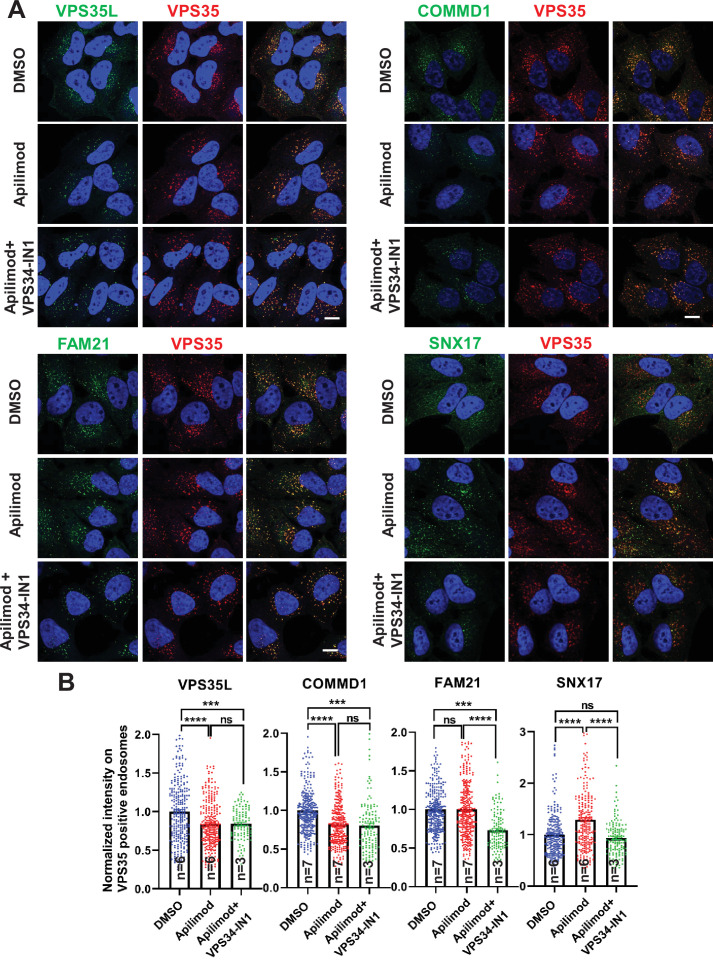
Figure 7—source data 1. Contains numerical source data for Figure 7.

Figure 7.

Figure 7—figure supplement 1. Acute inhibition of PIKfyve results in a loss of the CCC complex subunits, COMMD5 and CCDC93 from endosomes.

Figure 7—figure supplement 1.

(A–B) HeLa cells treated with DMSO or 1 µM apilimod for 30 min were fixed, permeabilized, and co-stained with antibodies against VPS35 and COMMD5. A mask of VPS35-positive endosomes was generated, and the intensity of COMMD5 within this location was quantified. Values were normalized to the corresponding average intensity of the DMSO treatment cohort (B). (C–D) HEK293 cells treated with DMSO or 1 µM apilimod for 30 min were fixed, permeabilized and co-stained with antibodies against VPS35 and CCDC93. A mask of VPS35-positive endosomes was generated, and the intensity of CCDC93 within this location was quantified. Values were normalized to the corresponding average intensity of the DMSO treatment cohort (D). Data presented as mean ± SE. Statistical significance from three independent experiments were analyzed using unpaired two-tailed Student’s t-test. ***p < 0.005 and ****p < 0.001, and ns not significant. Bar: 20 µm.
Figure 7—figure supplement 1—source data 1. Contains numerical source data for Figure 7—figure supplement 1.
Figure 7—figure supplement 2. Depletion of PIKfyve causes a loss of the endosomal localization of COMMD1 which is rescued by PIKfyve expression.

Figure 7—figure supplement 2.

HeLa cells transfected with PIKfyve siRNA or no siRNA for 3 days were either untransfected or transfected with 6xHA-PIKfyve for the last 18 hr of transfection. Cells were fixed, immunostained with antibodies to COMMD1, VPS35, and HA-tag (6xHA-PIKfyve). The intensity of COMMD1 in VPS35 puncta per cell was quantified and the values were normalized to the no siRNA control. Data presented as mean ± SE. Statistical significance from three independent experiments were quantified with one-way ANOVA followed by Tukey’s post hoc. *p < 0.05, ***p < 0.005. Bar: 10 µm.
Figure 7—figure supplement 2—source data 1. Contains numerical source data for Figure 7—figure supplement 2.
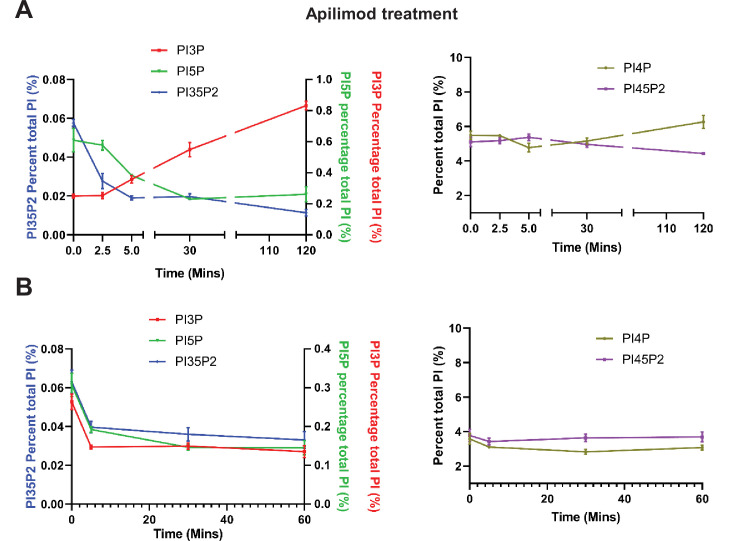
Figure 7—figure supplement 3. Apilimod and VPS34-IN1 are potent inhibitors of PIKfyve and VPS34, respectively.

Figure 7—figure supplement 3.

(A) Mouse embryonic fibroblast (MEF) cells were incubated with myo-[2 H3] inositol labeled media for 48 hr and cells were either untreated or treated with 1 µM apilimod for the last 2.5, 5, 30, or 120 min of the labeling. Note that phosphatidylinositol 3-phosphate (PI3P) is elevated approximately 4-fold at 120 min of treatment. Levels of individual phosphoinositide lipids were quantified (data adapted from McCartney et al., 2014b). (B) MEF cells were incubated with myo-[2 H3] inositol labeled media for 48 hr and cells were either untreated or treated with 1 µM VPS34-IN1 for the last 5, 30, or 60 min of the labeling. Levels of individual phosphoinositide lipids were quantified. Data presented as mean ± SE from three independent experiments.
Figure 7—figure supplement 3—source data 1. Contains numerical source data for Figure 7—figure supplement 3.
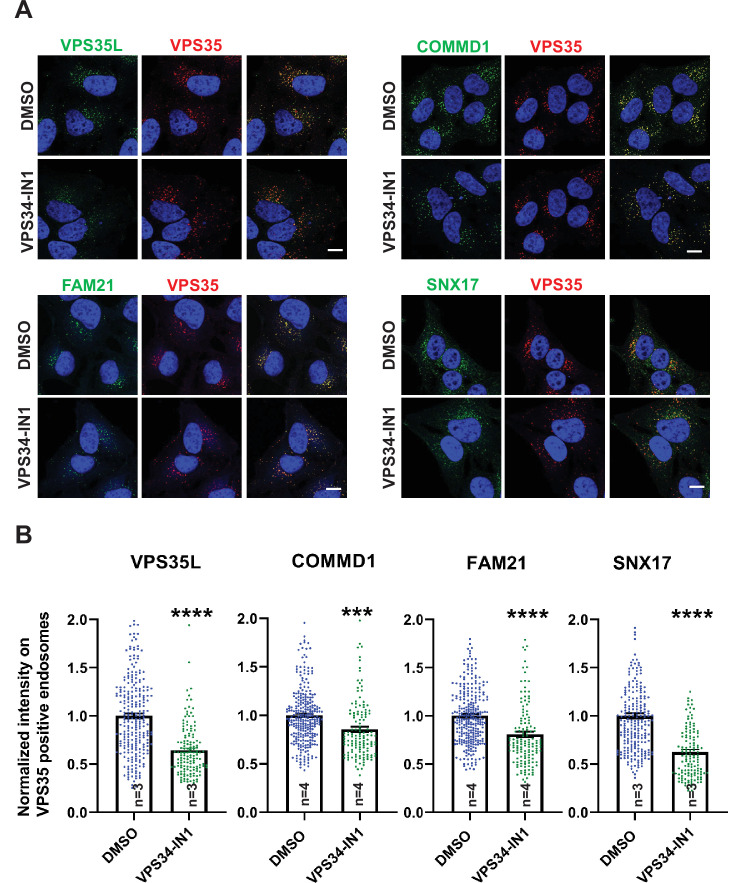
Figure 7—figure supplement 4. Inhibition of the PI3-kinase, VPS34 results in a loss of SNX17, CCC, Retriever, and WASH complexes from endosomes.

Figure 7—figure supplement 4.

(A) HeLa cells treated with DMSO or 1 µM VPS34-IN1 for 30 min were fixed, permeabilized, and co-stained with antibodies against VPS35 (A–D) and antibodies against either COMMD1, VPS35L, FAM21, and SNX17. (B) The intensity of COMMD1, VPS35L, FAM21, and SNX17 on VPS35-positive endosomes was quantified and values were normalized to the corresponding average intensity of the DMSO treatment cohort. Data presented as mean ± SE. Statistical significance from three or four independent experiments was analyzed using unpaired two-tailed Student’s t-test. ***p < 0.005 and ****p < 0.001, and ns not significant. Bar: 10 µm.
Figure 7—figure supplement 4—source data 1. Contains numerical source data for Figure 7—figure supplement 4.
Figure 7—figure supplement 5. Partial inhibition of VPS34 with 0.1 mM VPS34-IN1 combined with treatment with apilimod prevents the elevation of total cellular pools of phosphatidylinositol 3-phosphate (PI3P).

Figure 7—figure supplement 5.

Mouse embryonic fibroblast (MEF) cells were incubated with myo-[2 H3] inositol labeled media for 48 hr. Cells were either treated with DMSO, 1 µM apilimod or co-treated with 1 µM apilimod and 0.1 µM or 0.01 µM VPS34-IN1 for the last 30 min of the labeling. Levels of individual phosphoinositide lipids were quantified. Data presented as mean ± SE. Statistical significance from three independent experiments were analyzed using one-way ANOVA and Tukey’s post hoc tests. *p < 0.05, **p < 0.01, ***p < 0.005, and ****p < 0.001, and ns not significant.
Figure 7—figure supplement 5—source data 1. Contains numerical source data for Figure 7—figure supplement 5.
Figure 7—figure supplement 6. Mild cell permeabilization resulted in the release of SNX17-related proteins.

Figure 7—figure supplement 6.

Mild cell permeabilization was tested as an approach to determine changes in membrane association of the indicated SNX17 pathway-related proteins following treatment with apilimod or VPS34-INH. However, that only a small fraction (5–20%) of most of the proteins tested remained following vehicle control treatment, indicates that this approach is not useful. Other biochemical approaches or milder conditions need to be developed. The release of the SNX17-related proteins suggests that they are predominantly cytosolic or weakly associate with membranes. HeLa cells treated with either DMSO, 1 µM apilimod, 1 µM VPS34-IN1, or co-treated with 1 µM apilimod and 0.1 µM VPS34-IN1 for 2 hr were permeabilized with 100 µg/ml digitonin for 2 min at room temperature. Then, cells were washed twice with PBS and directly lysed with sample buffer and analyzed by western blot. GAPDH and transferrin receptor (TFR1) were used as controls for cytosolic and membrane proteins, respectively. Intensity of the indicated protein was quantified relative to transferrin receptor and the percentage of protein remaining after permeabilization was quantified relative to the corresponding unpermeabilized cells for each treatment.
Figure 7—figure supplement 6—source data 1. Contains numerical source data and uncropped western blot source data for Figure 7—figure supplement 6.
Figure 7—figure supplement 7. Summary of the effect of inhibitor treatment on phosphoinositide lipid levels and the endosomal localization of SNX17, WASH, CCC, and Retriever subunits.

Figure 7—figure supplement 7.

Green and red arrows indicate an increase or decrease in the endosomal localization of the protein, respectively.
Figure 7—figure supplement 8. Acute inhibition of PIKfyve does not alter cortactin colocalization on Vps35 endosomes.

Figure 7—figure supplement 8.

(A) HeLa cells grown on coverslips were treated with either DMSO or 1 µM apilimod for 30 min. Cells were fixed, permeabilized, and incubated with antibodies against cortactin and VPS35. Scale bar: 10 µm. (B) The intensity of cortactin on VPS35-positive endosomes was quantified and values were normalized to the average of DMSO-treated cells. Data presented as mean ± SE. Statistical significance of data from three independent experiments was analyzed using an unpaired two-tailed Student’s t-test. ns, not significant.
Figure 7—figure supplement 8—source data 1. Contains numerical source data for Figure 7—figure supplement 8.