
Figure 3.
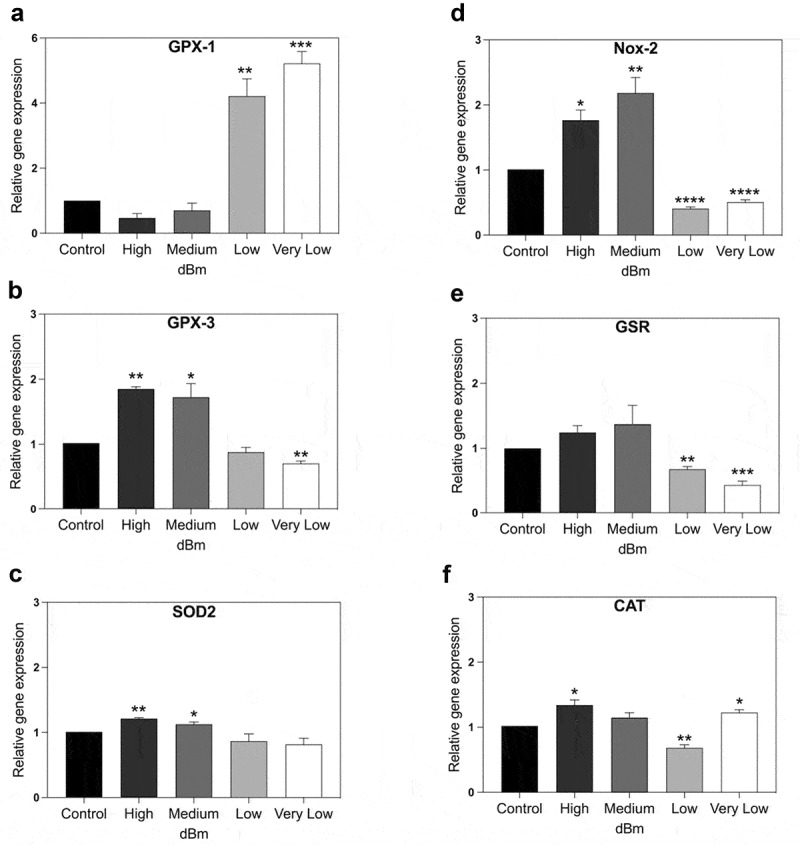
qPCR gene expression analysis of genes implicated in control of cellular ROS. HEK Cell cultures were exposed for 15 min to Control (background): −96 dBm; High: −8.5 dBm; Medium: – 31 dBm; Low: – 55 dBm; Very Low: – 67 dBm signal amplitudes. Gene expression was normalized to the Control (unexposed) conditions; statistical analysis was performed by ANOVA comparison of the exposed (High and Medium RF amplitude) to the Control (unexposed condition). Data are shown as mean ± SE of three independent experiments (N = 3). A – F. Expression of the indicated seven genes were compared at different amplitudes. Statistical analysis was performed as described (Methods). Significance level of the differences are as follows: *p-value < 0.1; ** p-value < 0.01; *** p-value < 0.01.