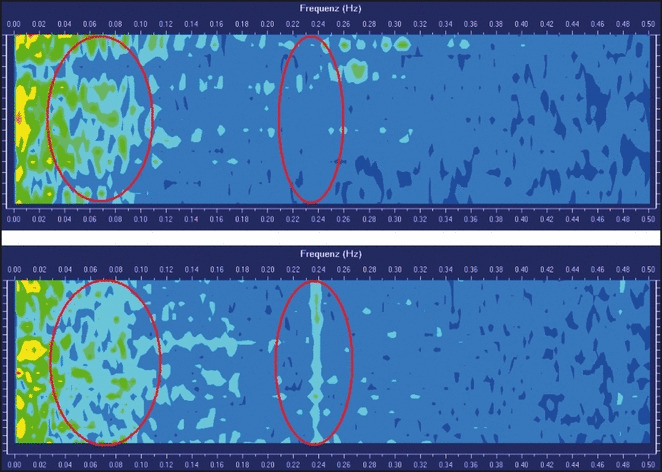
Figure FIGURE.

Heart rate variability spectral analyses from a 24‐h Holter‐electrocardiographic registration before (top) and 3 months after percutaneous renal denervation (bottom) in the same patient. Decrease of low‐frequency spectral component and increase of high‐frequency spectral component occurred after percutaneous renal denervation, reflecting decreased sympathetic cardiac tone.
