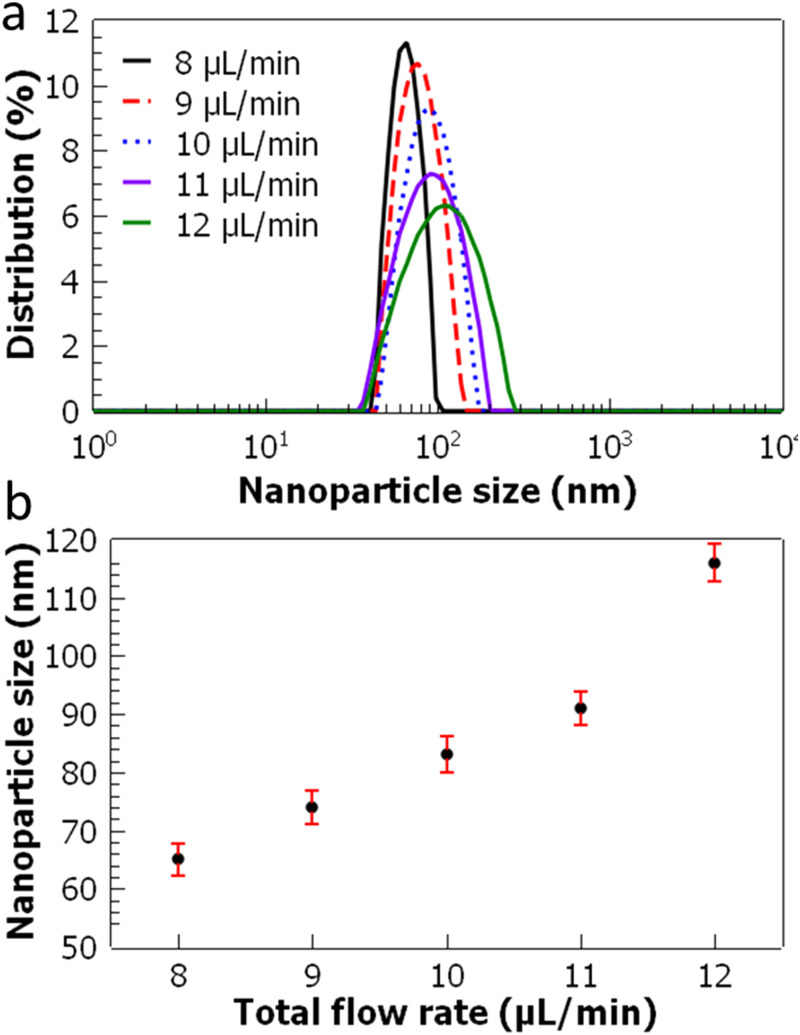
FIG. 7.
Characterization of PLGA nanoparticles as a function of the total flow rate. (a) Nanoparticle size distributions are shown. (b) Nanoparticle size is plotted as a function of the total flow rate. The polymer to water flow rate ratio is kept constant at 0.3. The error bars represent the standard deviation of three repeated experiments.

