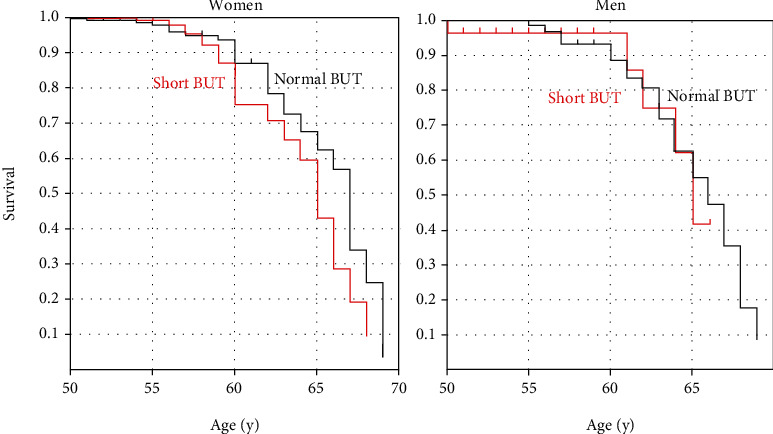
Figure 1.

Kaplan-Meier plot of (a) women and (b) men showing the age at which individuals in the short (red line) and normal (black line) BUT groups reached the near add power endpoint of +3.00 D. The short BUT group reached the endpoint of +3.00 D significantly earlier than the normal BUT group (P = 0.043; Cox-Mantel test) in women, but this was not observed in men (P = 0.759). BUT: tear breakup time.
