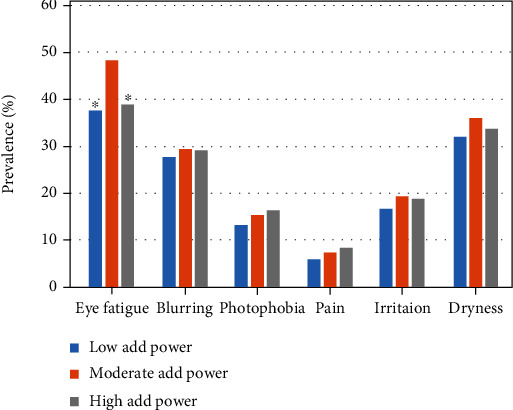
Figure 2.

Prevalence of symptoms and near add power. Near add power was classified as low (+0.25 to +1.00 D), moderate (+1.25 to +2.00 D), and high (+2.25 to +3.00 D). A significant difference was observed in the prevalence of eye fatigue (vs. moderate add power group, chi-squared test). ∗P < 0.001.
