Figure 2.

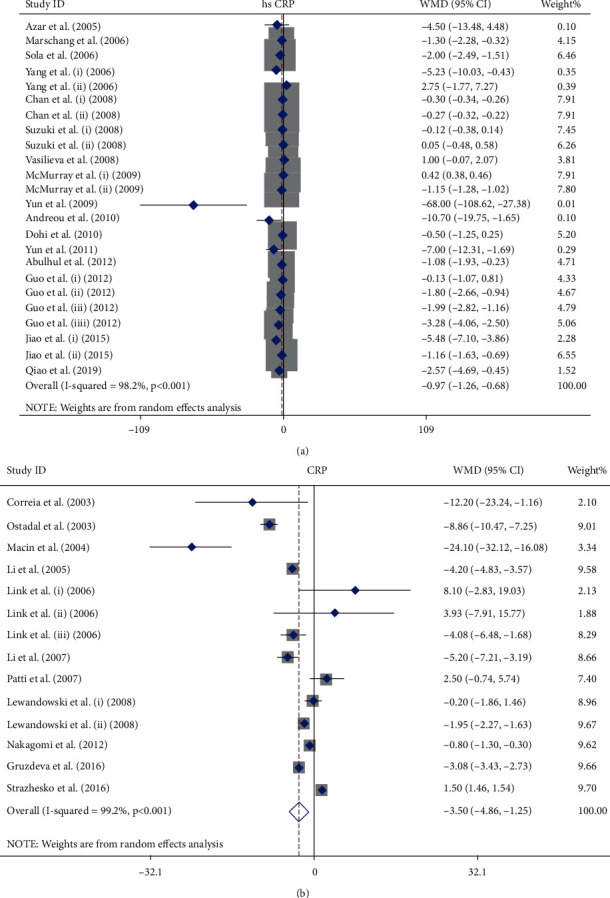
Forest plot presenting WMD and 95% CI for the effect of statin administration on hs-CRP (a) and CRP (b) levels in the overall population.

Forest plot presenting WMD and 95% CI for the effect of statin administration on hs-CRP (a) and CRP (b) levels in the overall population.