Figure 8.

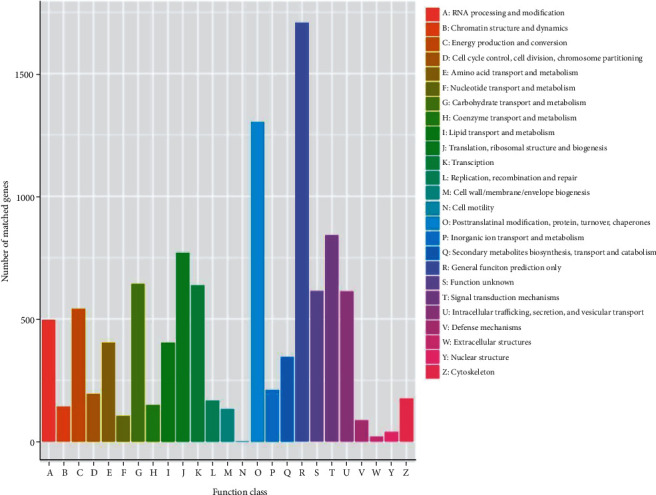
The KOG classification of tiger lily transcripts. The x-axis and y-axis represent the subcategories and the number of transcripts, accordingly.

The KOG classification of tiger lily transcripts. The x-axis and y-axis represent the subcategories and the number of transcripts, accordingly.