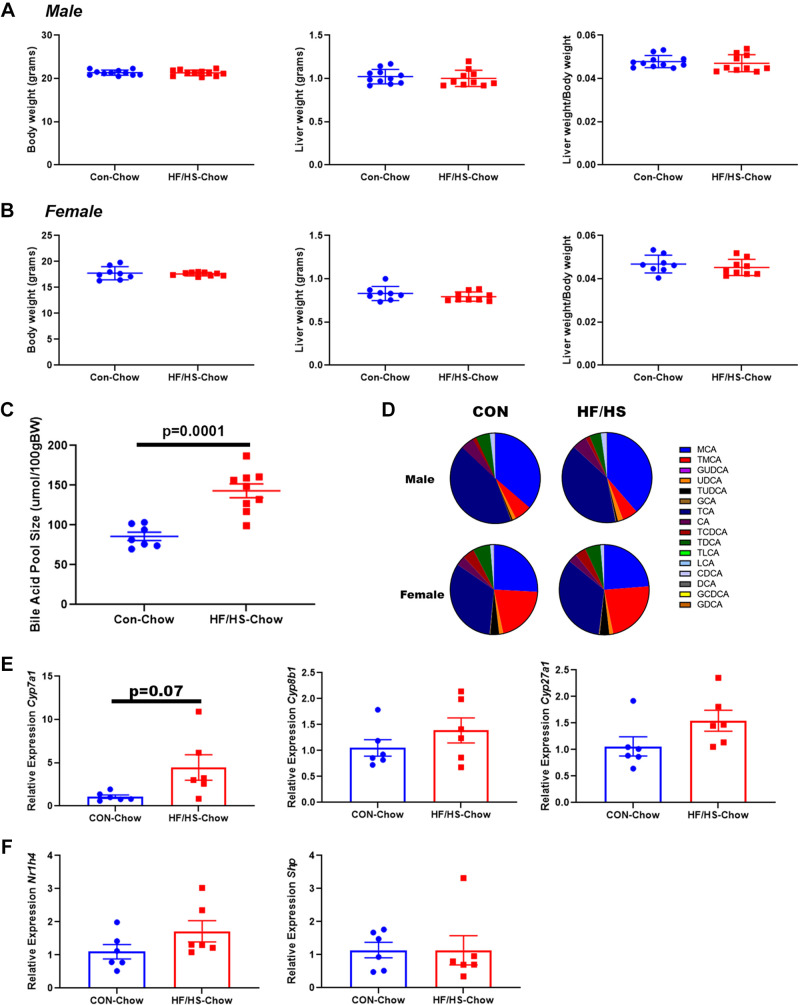
Figure 9.
Altered bile acid (BA) homeostasis in second generation offspring of male exposed to maternal obesogenic diet. A: body weight, liver weight, and liver weight/body weight in male offspring. B: body weight, liver weight, and liver weight-to-body weight ratio in female offspring. C: BA pool size of PF2 high-fat/high-sucrose (HF/HS) and chow (CON) male offspring. D: abundance of individual BAs in liver of PF2 HF/HS and CON male and female offspring. E: relative expression of bile acid metabolism genes in PF2 HF/HS and CON male offspring liver. F: relative expression of Nr1h4 and Shp in PF2 HF/HS and CON male offspring liver. Quantitative data presented as means ± SE with n ≥ 6 in each group and ≥6 separate litters represented in each group. P values as noted on each graph for t tests.

