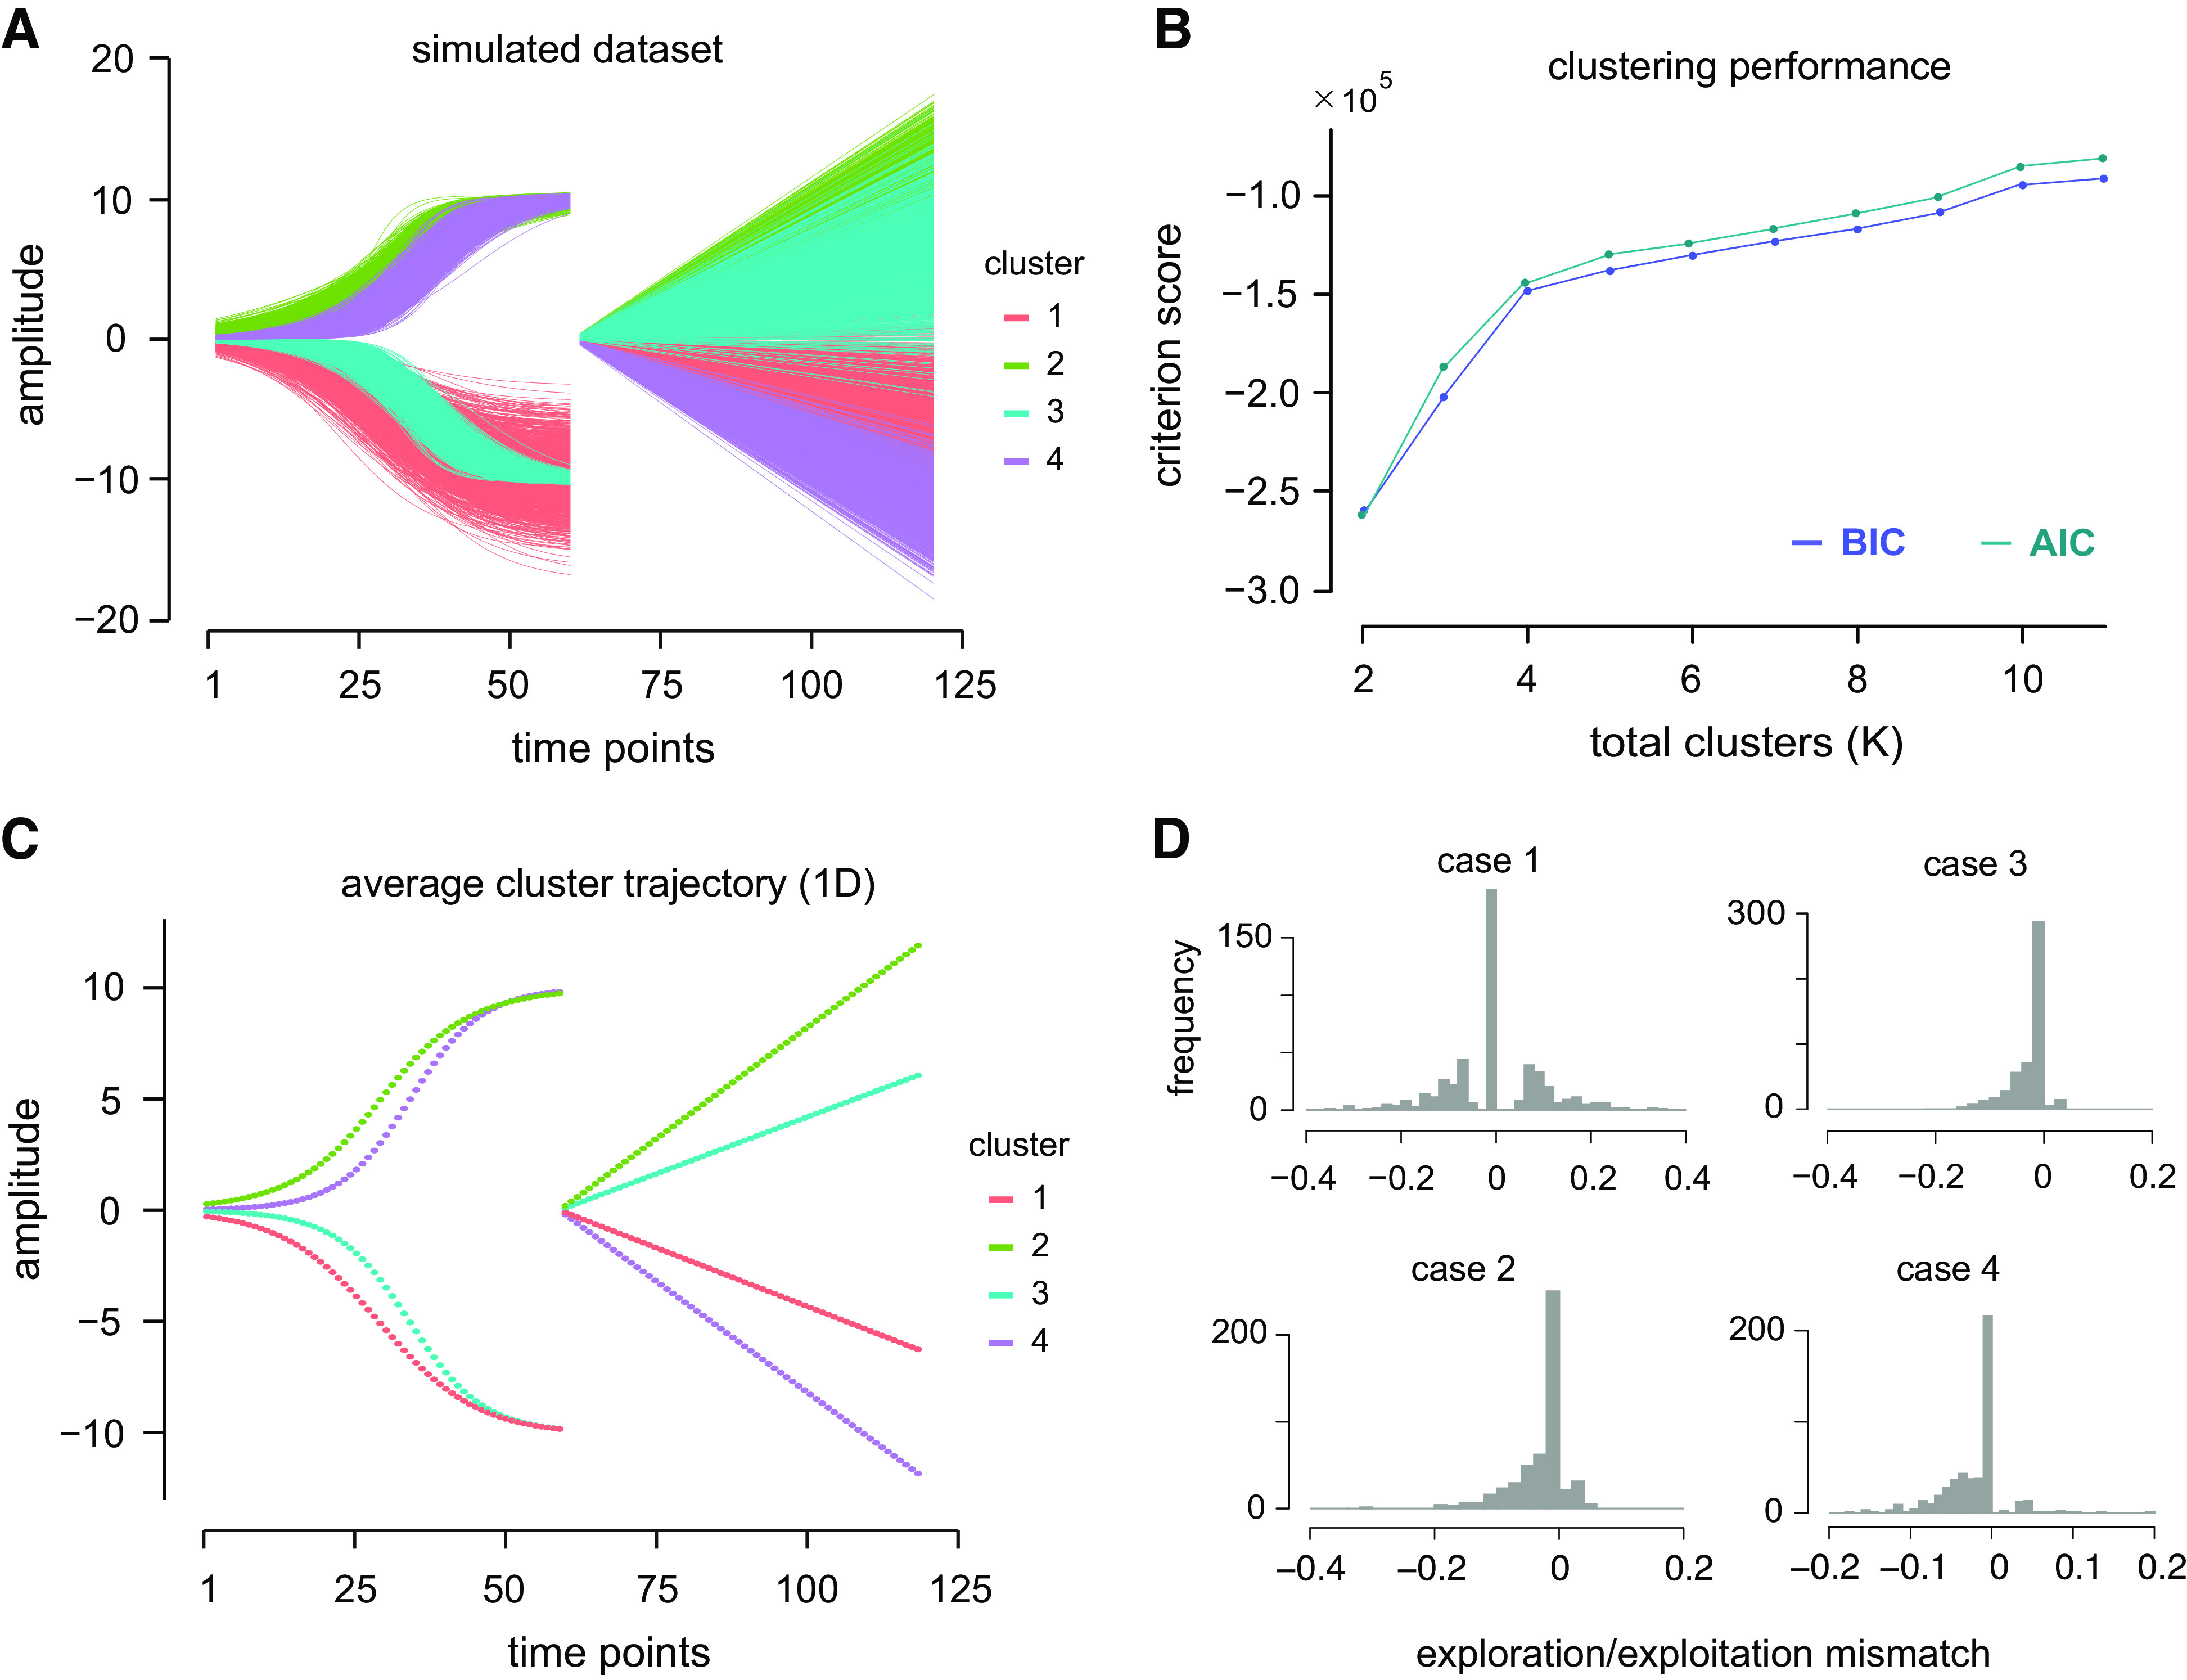
Figure 1.

A: simulated data generated from a known set of distributions for the purpose of cluster validation and to test the effectiveness of the algorithm. Altogether, the data comprised K = 4 groups, each having n = 500 time-varying observations. A single observation was produced by an exponential function that was concatenated temporally with a linear function. B: from the clustering procedure on the simulated data set, the optimum number of clusters was selected as the first instance at which the Bayesian information criterion (BIC) approached a plateau at K = 4, a value that corresponds to the original K in the simulated data set. As a comparison, the Akaike information criterion (AIC) was placed alongside the BIC curve showing a comparable pattern. It is seen that there is reduced gain in the values of the criterion beyond this point. C: mean data set of each cluster for K = 4. Although the end points of the two exponential curves overlapped, they can be assigned to separate clusters if they differ in shape. D: distribution of the difference or mismatch between the true and estimated exploration-exploitation ratio (EER) for the simulated data set after bootstrapping. The high proportion of values centered around zero demonstrates that the clustering algorithm was able to produce exploration/exploitation values that are comparable with the ground truth.
