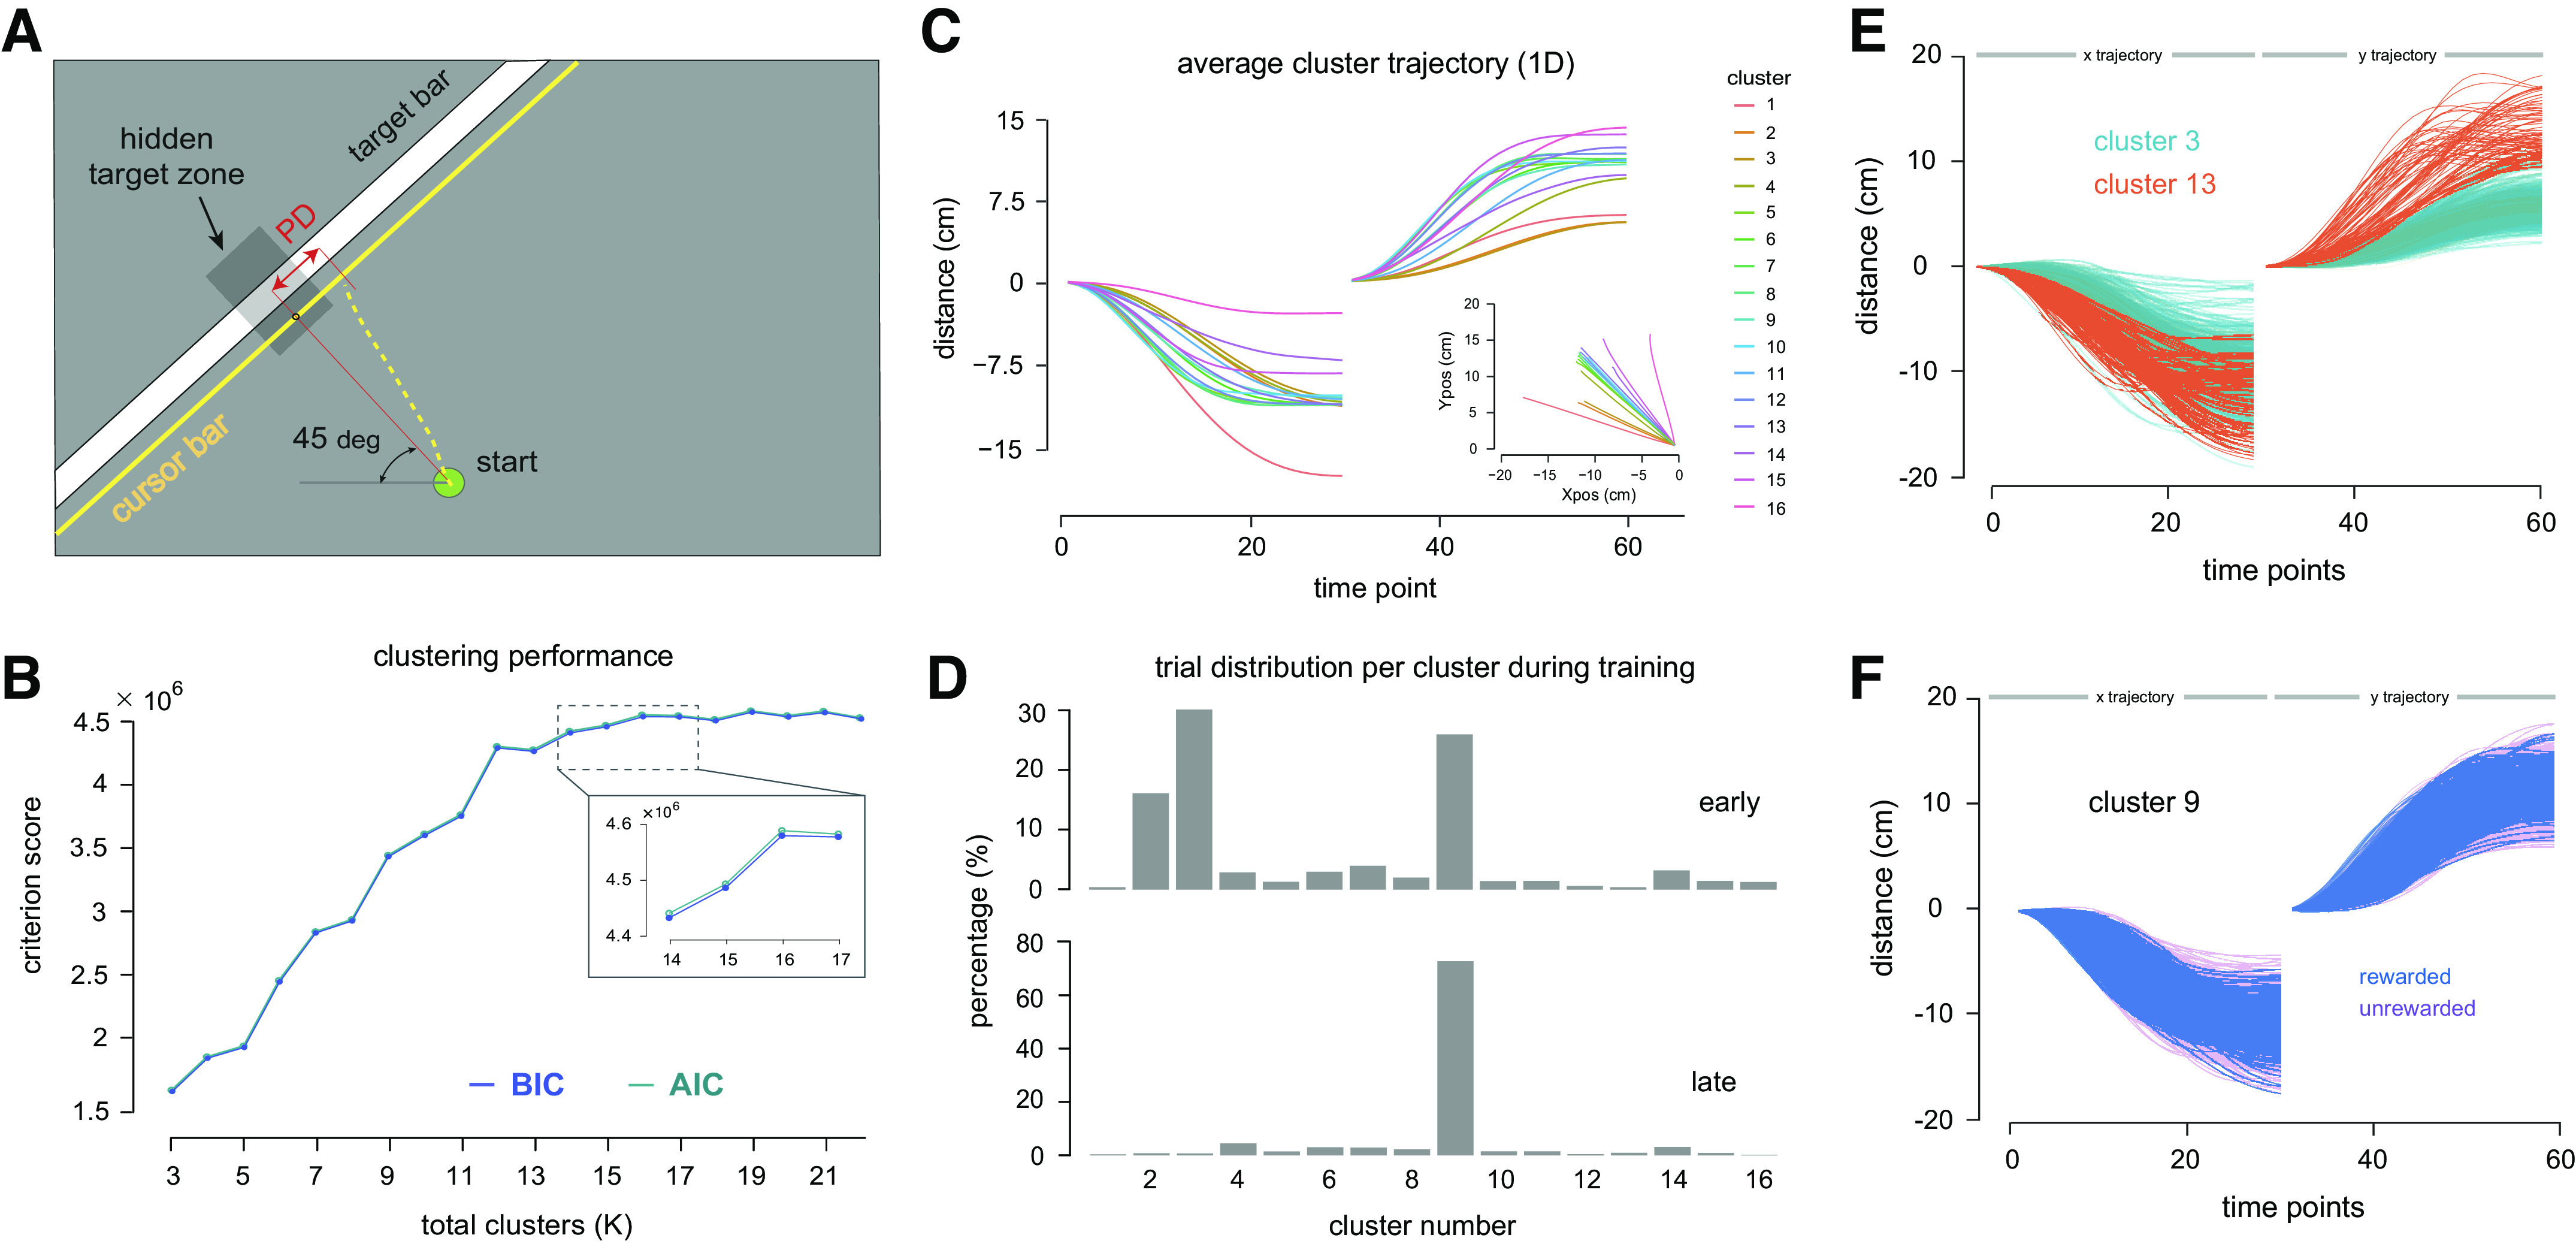
Figure 2.

A: task interface of the experiment. Participants were not able to see the cursor or their arm while moving. Instead, a thin yellow line parallel to the target bar was shown. No information about the lateral position of the hand was available at any point in the session. The width of the hidden target was manipulated in the large-to-small target (L-S) condition to increase demands on movement accuracy. PD, perpendicular deviation at movement endpoint. B: same as Fig. 1B, but the input to the clustering algorithm now came from the actual behavioral experiments. The optimum number of clusters was selected at K = 16. Both curves suggest that there is little gain in the Bayesian information criterion (BIC) and Akaike information criterion (AIC) values beyond this point. C: mean trajectory of each cluster over time. Data of both axes were concatenated together as a vector, where the first 30 data points are the X positions and the subsequent 30 data points are the Y positions. It can be seen that the mean trajectory of every cluster has its own unique spatial and temporal features in each axis. The output of the clustering algorithm was movements that were grouped into different clusters according to kinematic features. In the inset, mean trajectory of each cluster in a two-dimensional space is shown. D: proportion of training trials in each cluster in blocks 1 and 2 (top), and blocks 3 and 4 (bottom). It can be seen that cluster 9 comprised the greatest number of trials at the end of training (75%), up from 26% during the earlier blocks of training. Movements in this cluster also received the greatest amount of reward. In both C and D, the cluster numbering was ordered in such a way that cluster 1 and cluster 16 refer to movements deviated to the left and right of the target zone, respectively. E: trajectories belonging to two different clusters resulted from the clustering analysis. Similarity and distinction in the curvature in either X or Y axis or both contributed to the difference in the cluster assignment. The graph also depicts some degree of variation in the extent of similarity within a particular movement cluster. F: trajectories of cluster 9, showing successful (and thus, rewarded) trials superimposed on unsuccessful movements. All trajectories in the figure were aligned to the onset of movement.
