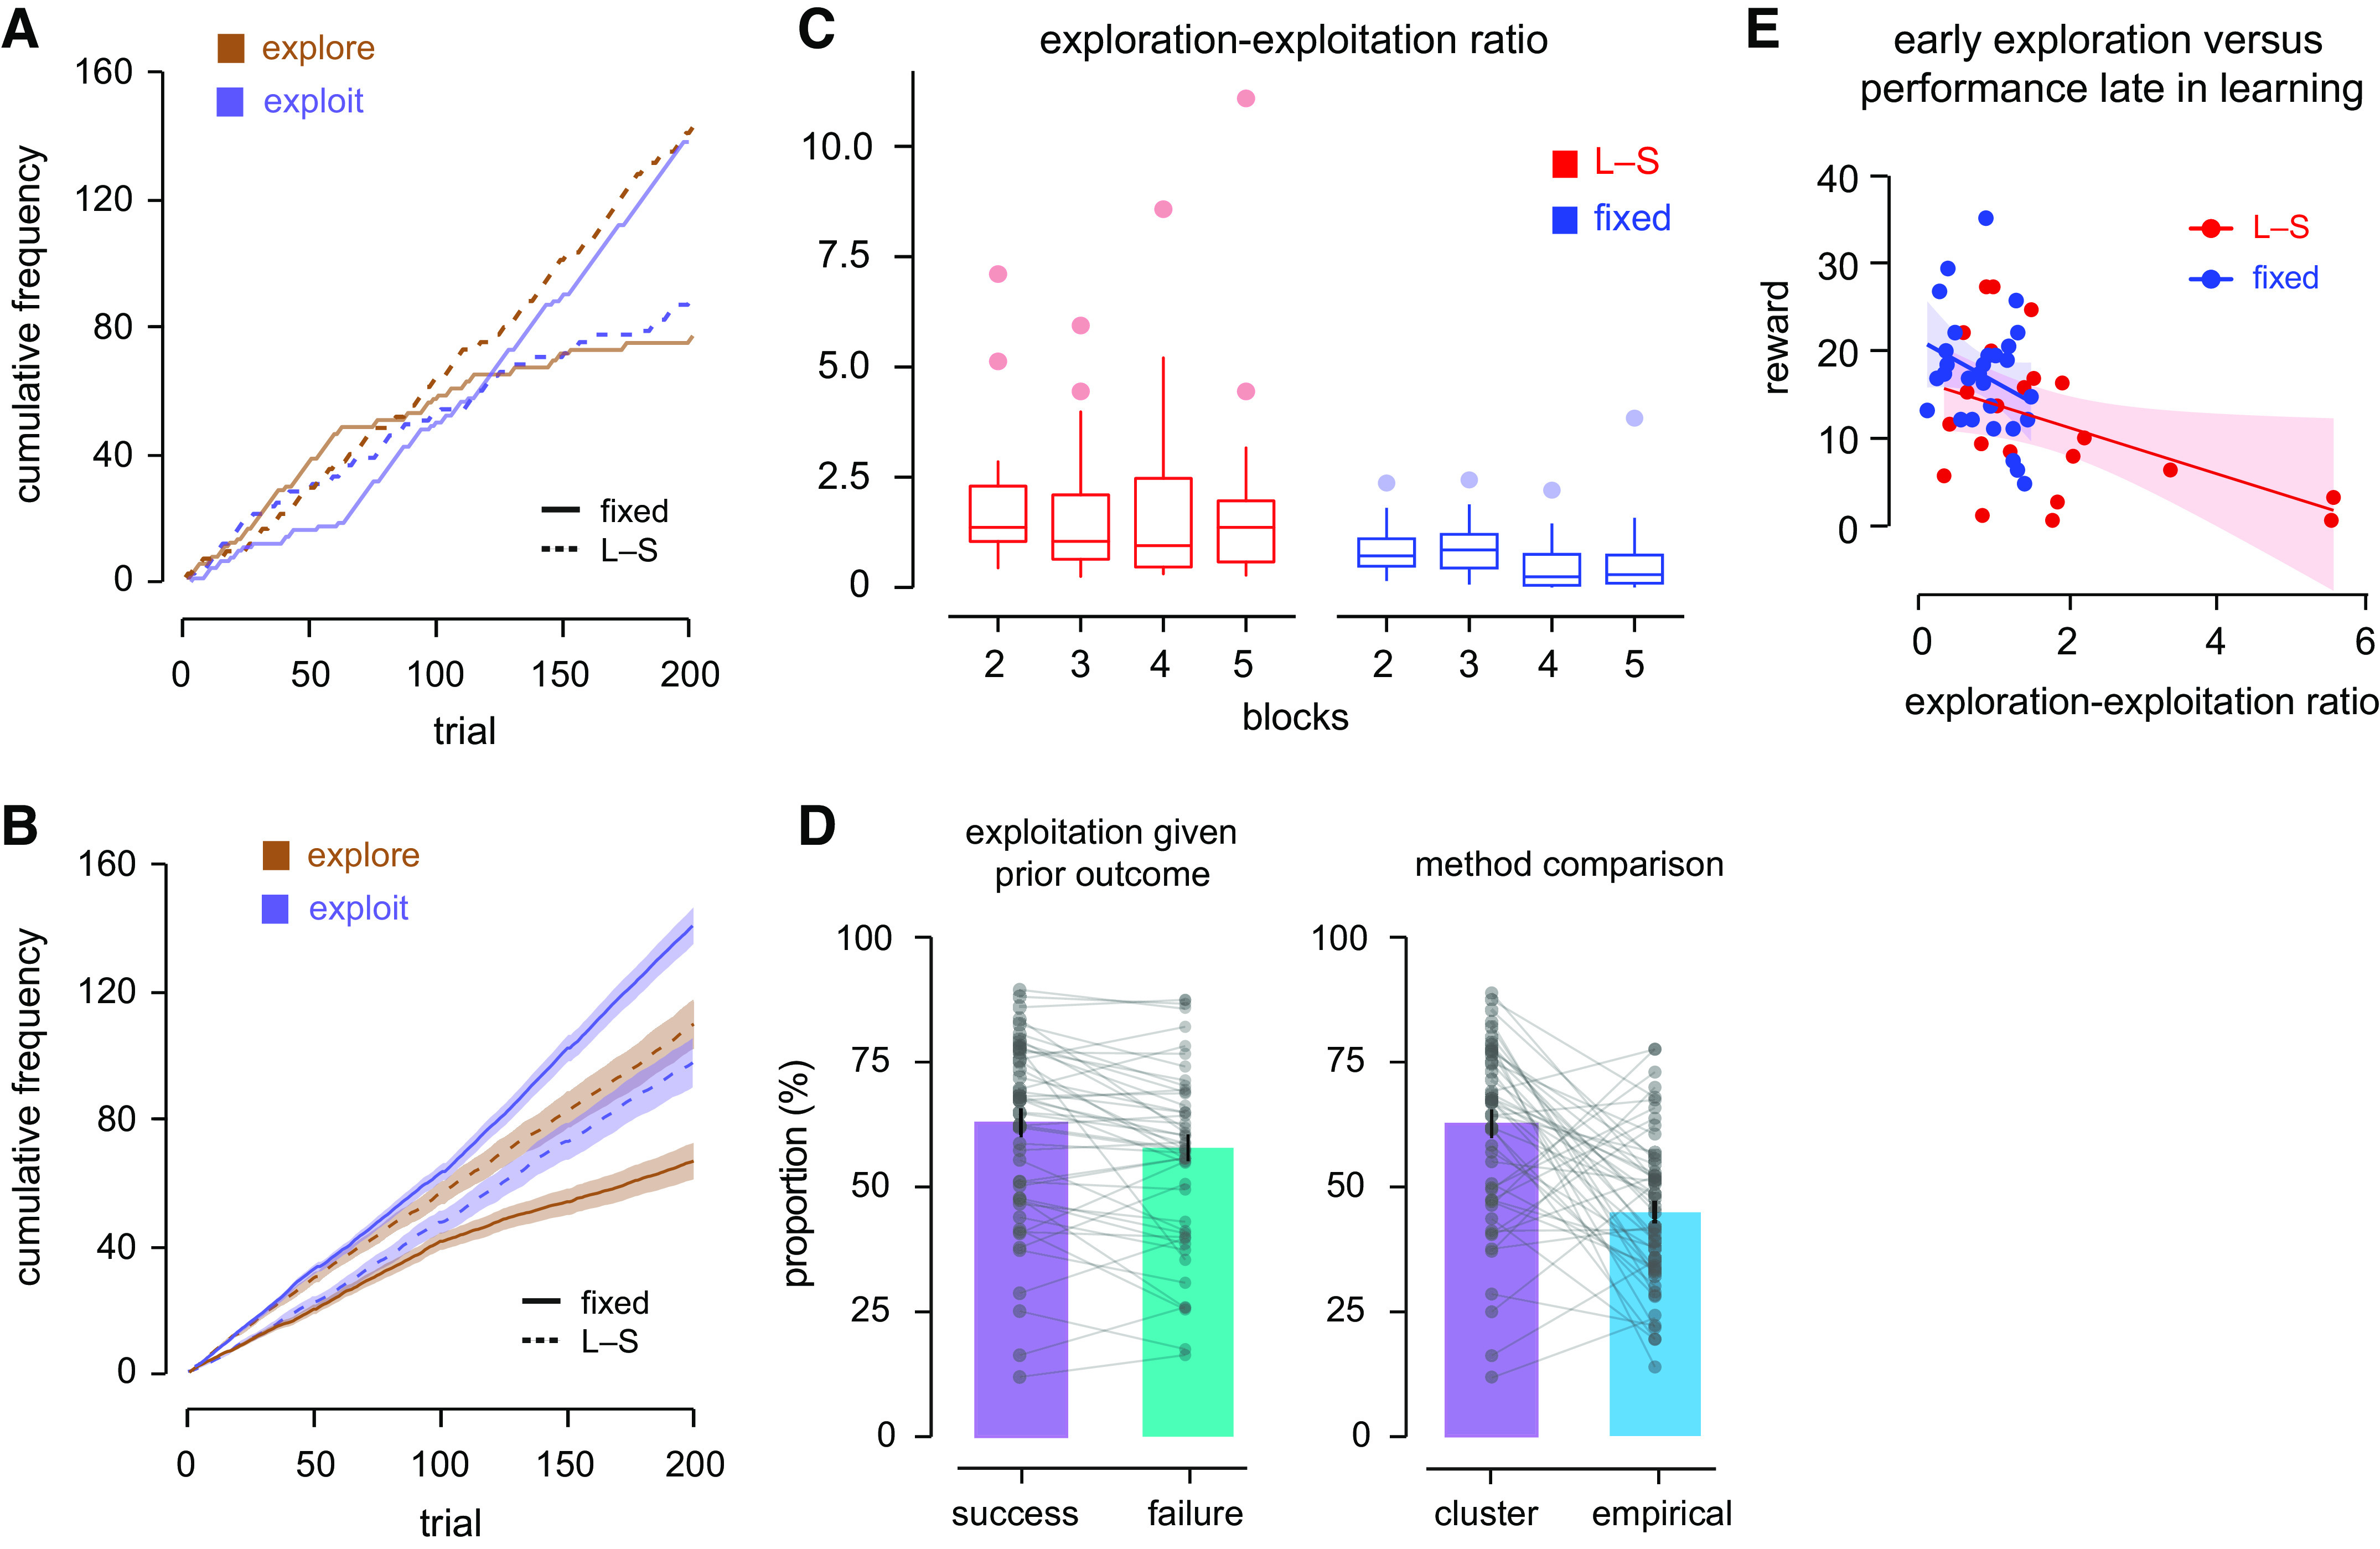
Figure 4.

A: cumulative frequency of exploration and exploitation of a representative participant from each experimental condition. The diagram shows the progression of each behavior over time during motor learning, and how one mode of behavior occurs more frequently than the other. B: same as A, but the cumulative frequency was averaged across all participants in each experimental condition. The shaded color represents the standard error. C: to characterize differences between experimental conditions in the choice of exploration over exploitation, a performance measure called exploration-exploitation ratio (EER) was computed early and late in learning (first two vs. last two blocks). On average, participants in the L-S condition used more exploration than exploitation as compared with those in the Fixed condition (see main text). D: repeating movements from the same cluster is termed exploitation. In the left panel, the proportion of trials in which there is exploitation following a rewarded trial is reliably greater than the proportion of trials in which exploitation occurs following failure. In the right panel, the proportion of trials in which there is exploitation following a rewarded trial is compared with the empirical calculation, which is defined as the proportion of trials in which a rewarded movement is repeated and rewarded for the second time. E: more exploration early in learning (first two blocks) was accompanied by fewer rewarded trials late in learning (last two blocks) in the large-to-small target (L-S) condition.
