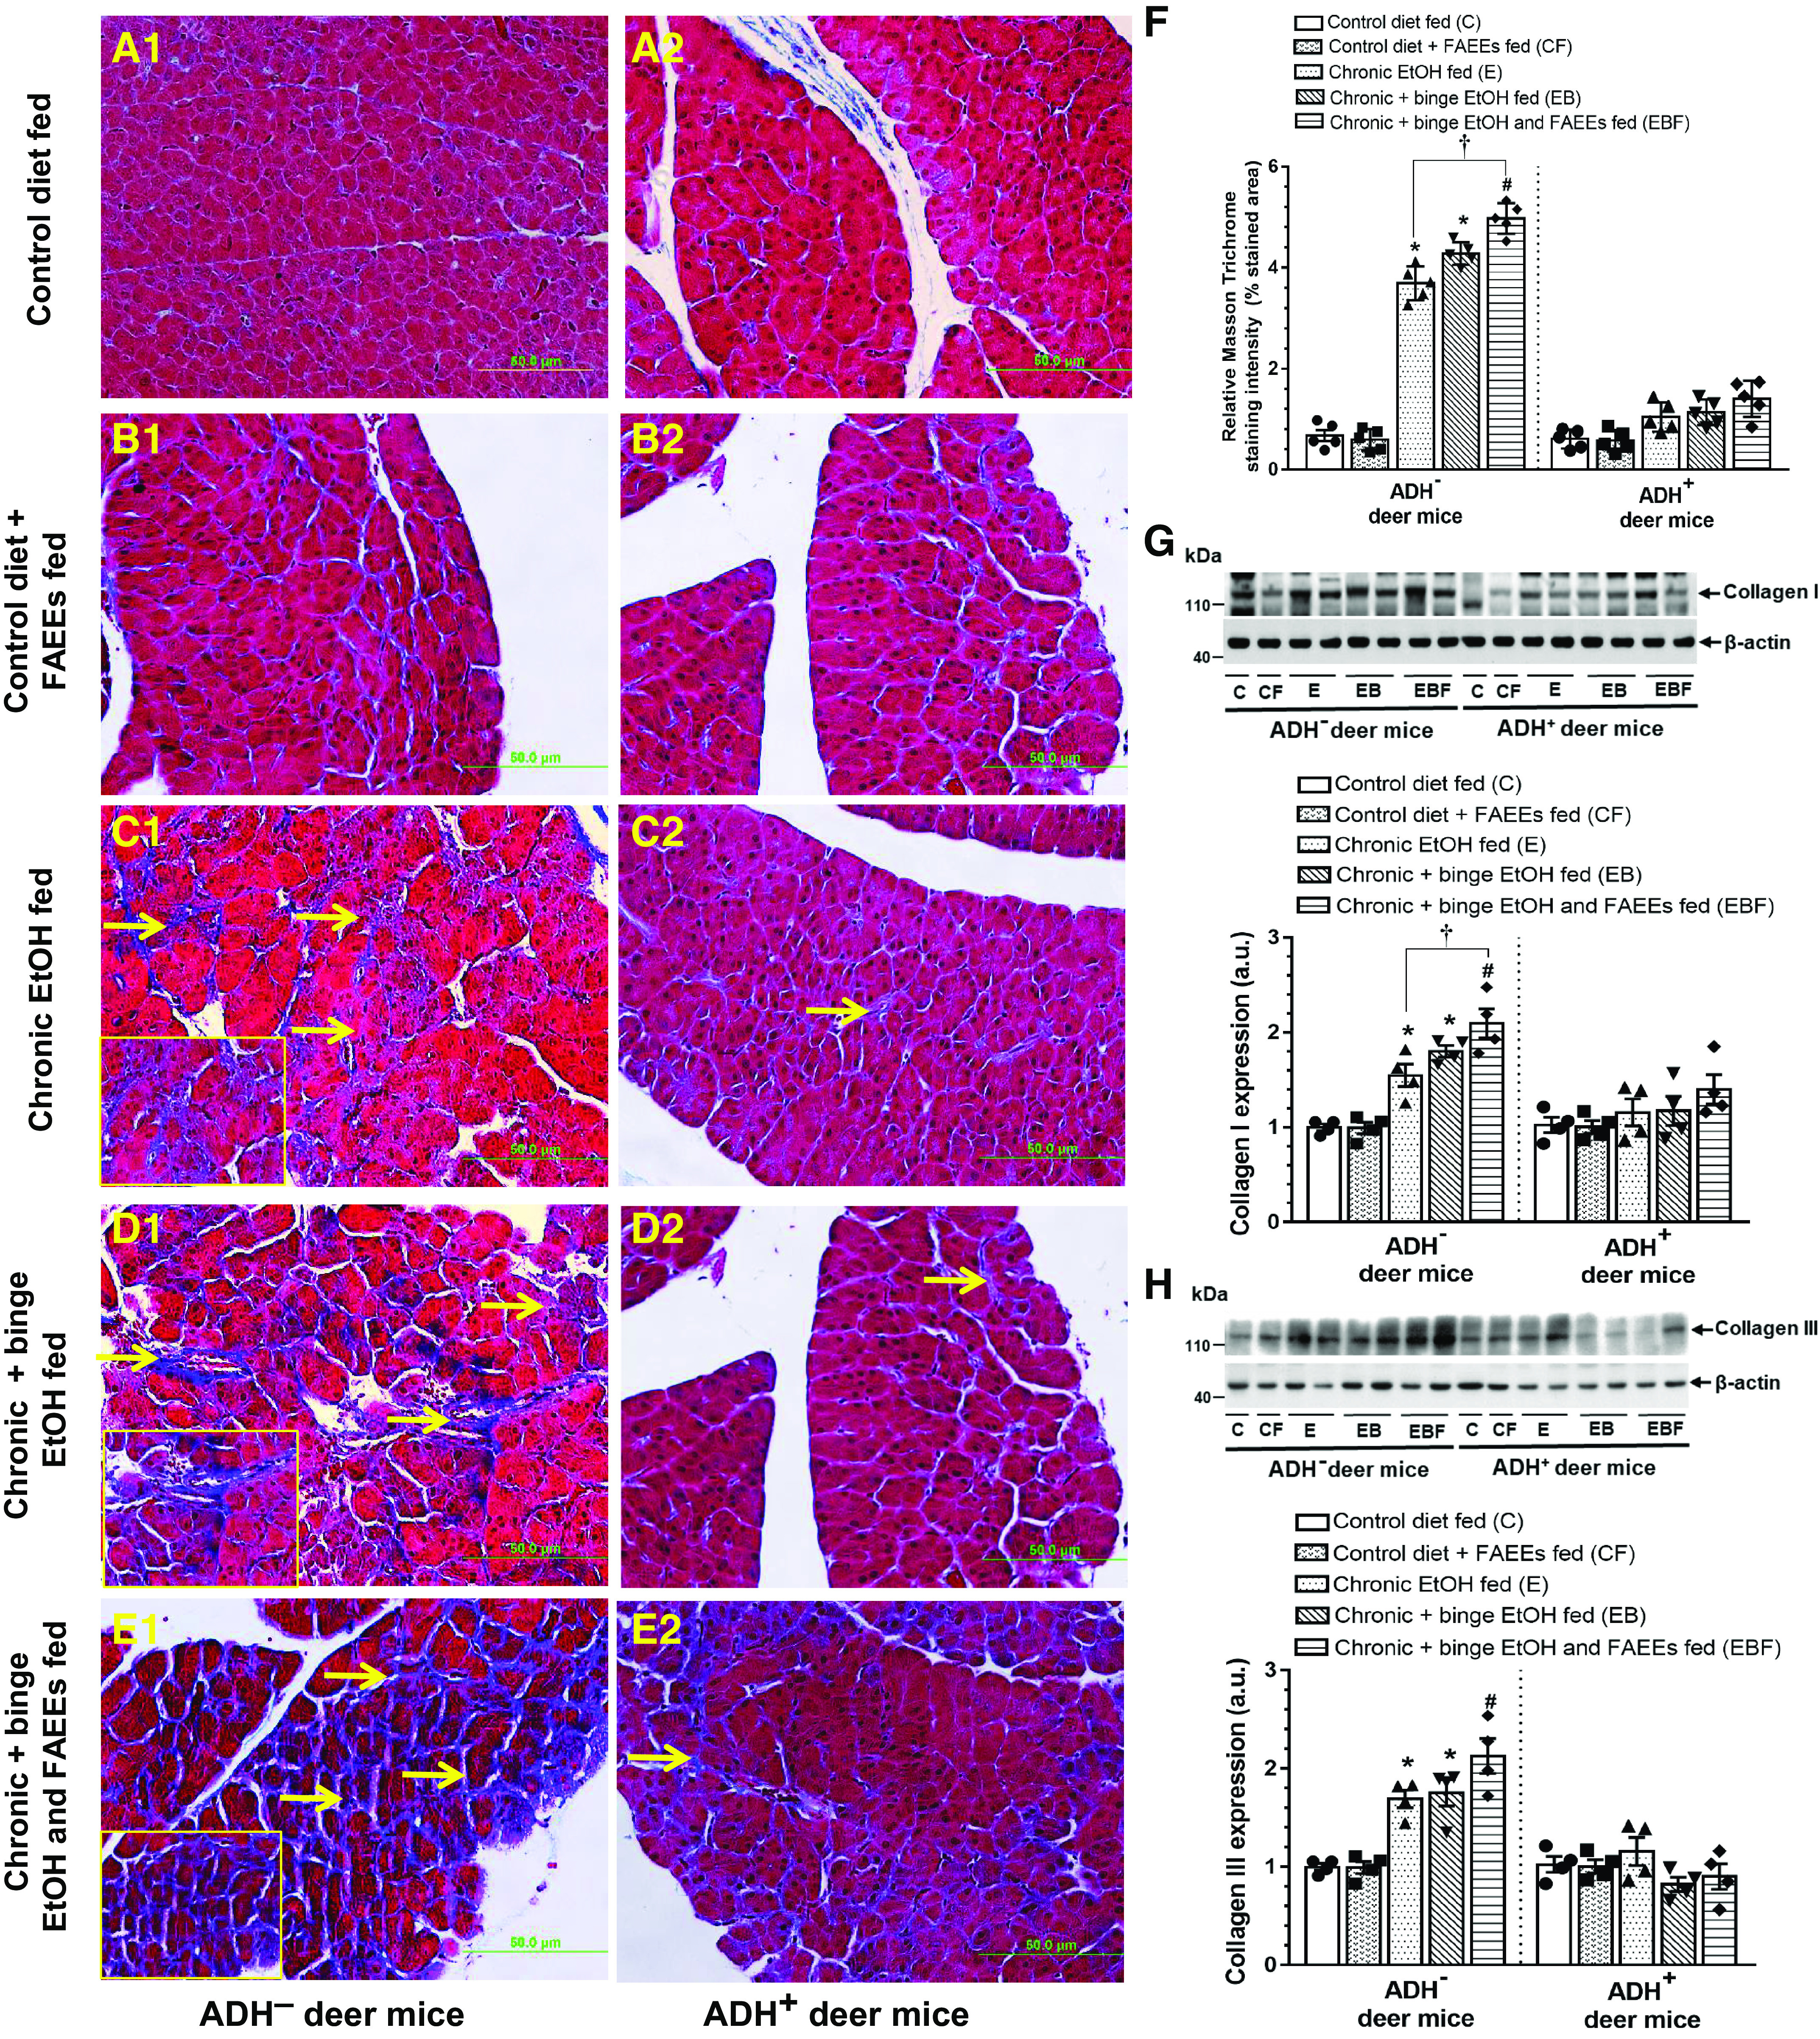
Figure 3.

Histological evaluation of fibrosis by Masson’s trichrome staining in pancreatic tissue sections of ADH− (A1–E1; left) and ADH+ (A2–E2; right) deer mice (Original magnification ×20, bar = 50 μm, n = 5 mice/group). Arrows represent deposition of collagen fibers implicating fibrosis. Pancreas of pair-fed control diet and control diet plus FAEEs-fed ADH− (A1 and B1) and ADH+ (A2 and B2) deer mice, show normal histology. Pancreas of chronic EtOH-fed (C1), chronic plus binge EtOH-fed (D1), and chronic plus binge EtOH and FAEEs-fed (E1) ADH− deer mice shows positive staining for Trichrome with mild to moderate degree of fibrosis, whereas chronic EtOH-fed (C2), chronic plus binge EtOH-fed (D2), and chronic plus binge EtOH and FAEEs-fed (E2) ADH+ deer mice show relatively normal histology. Inset shows area of higher magnification (X40). Quantification of the Masson Trichrome staining (F) in the pancreas of ADH− and ADH+ deer mice. Data are presented as means ± SE (n = 5 replicates). Representative immunoblots along with respective bar diagram show relative protein expression for collagen 1 (G) and collagen III (H) in pancreatic homogenate of various chronic EtOH-fed groups of ADH− and ADH+ deer mice. Intensities were normalized to β-actin (loading control). *P ≤ 0.05 chronic EtOH-fed group and chronic plus binge EtOH-fed group vs. pair-fed control diet group. Data were analyzed using ANOVA, followed by Tukey’s multiple comparisons test, and presented as means ± SE (n = 4 replicates). #P ≤ 0.05 chronic plus single binge EtOH and FAEEs-fed group vs. control diet plus FAEEs-fed group and †P ≤ 0.05 chronic plus binge EtOH and FAEEs-fed group vs. chronic EtOH-fed group, respectively. ADH−, alcohol dehydrogenase-deficient; C, pair-fed control diet group; CF, control diet plus FAEEs group; E, chronic EtOH-fed group; EB, chronic plus binge EtOH-fed group; EBF, chronic plus binge EtOH and FAEEs-fed group; FAEEs, fatty acid ethyl esters.
